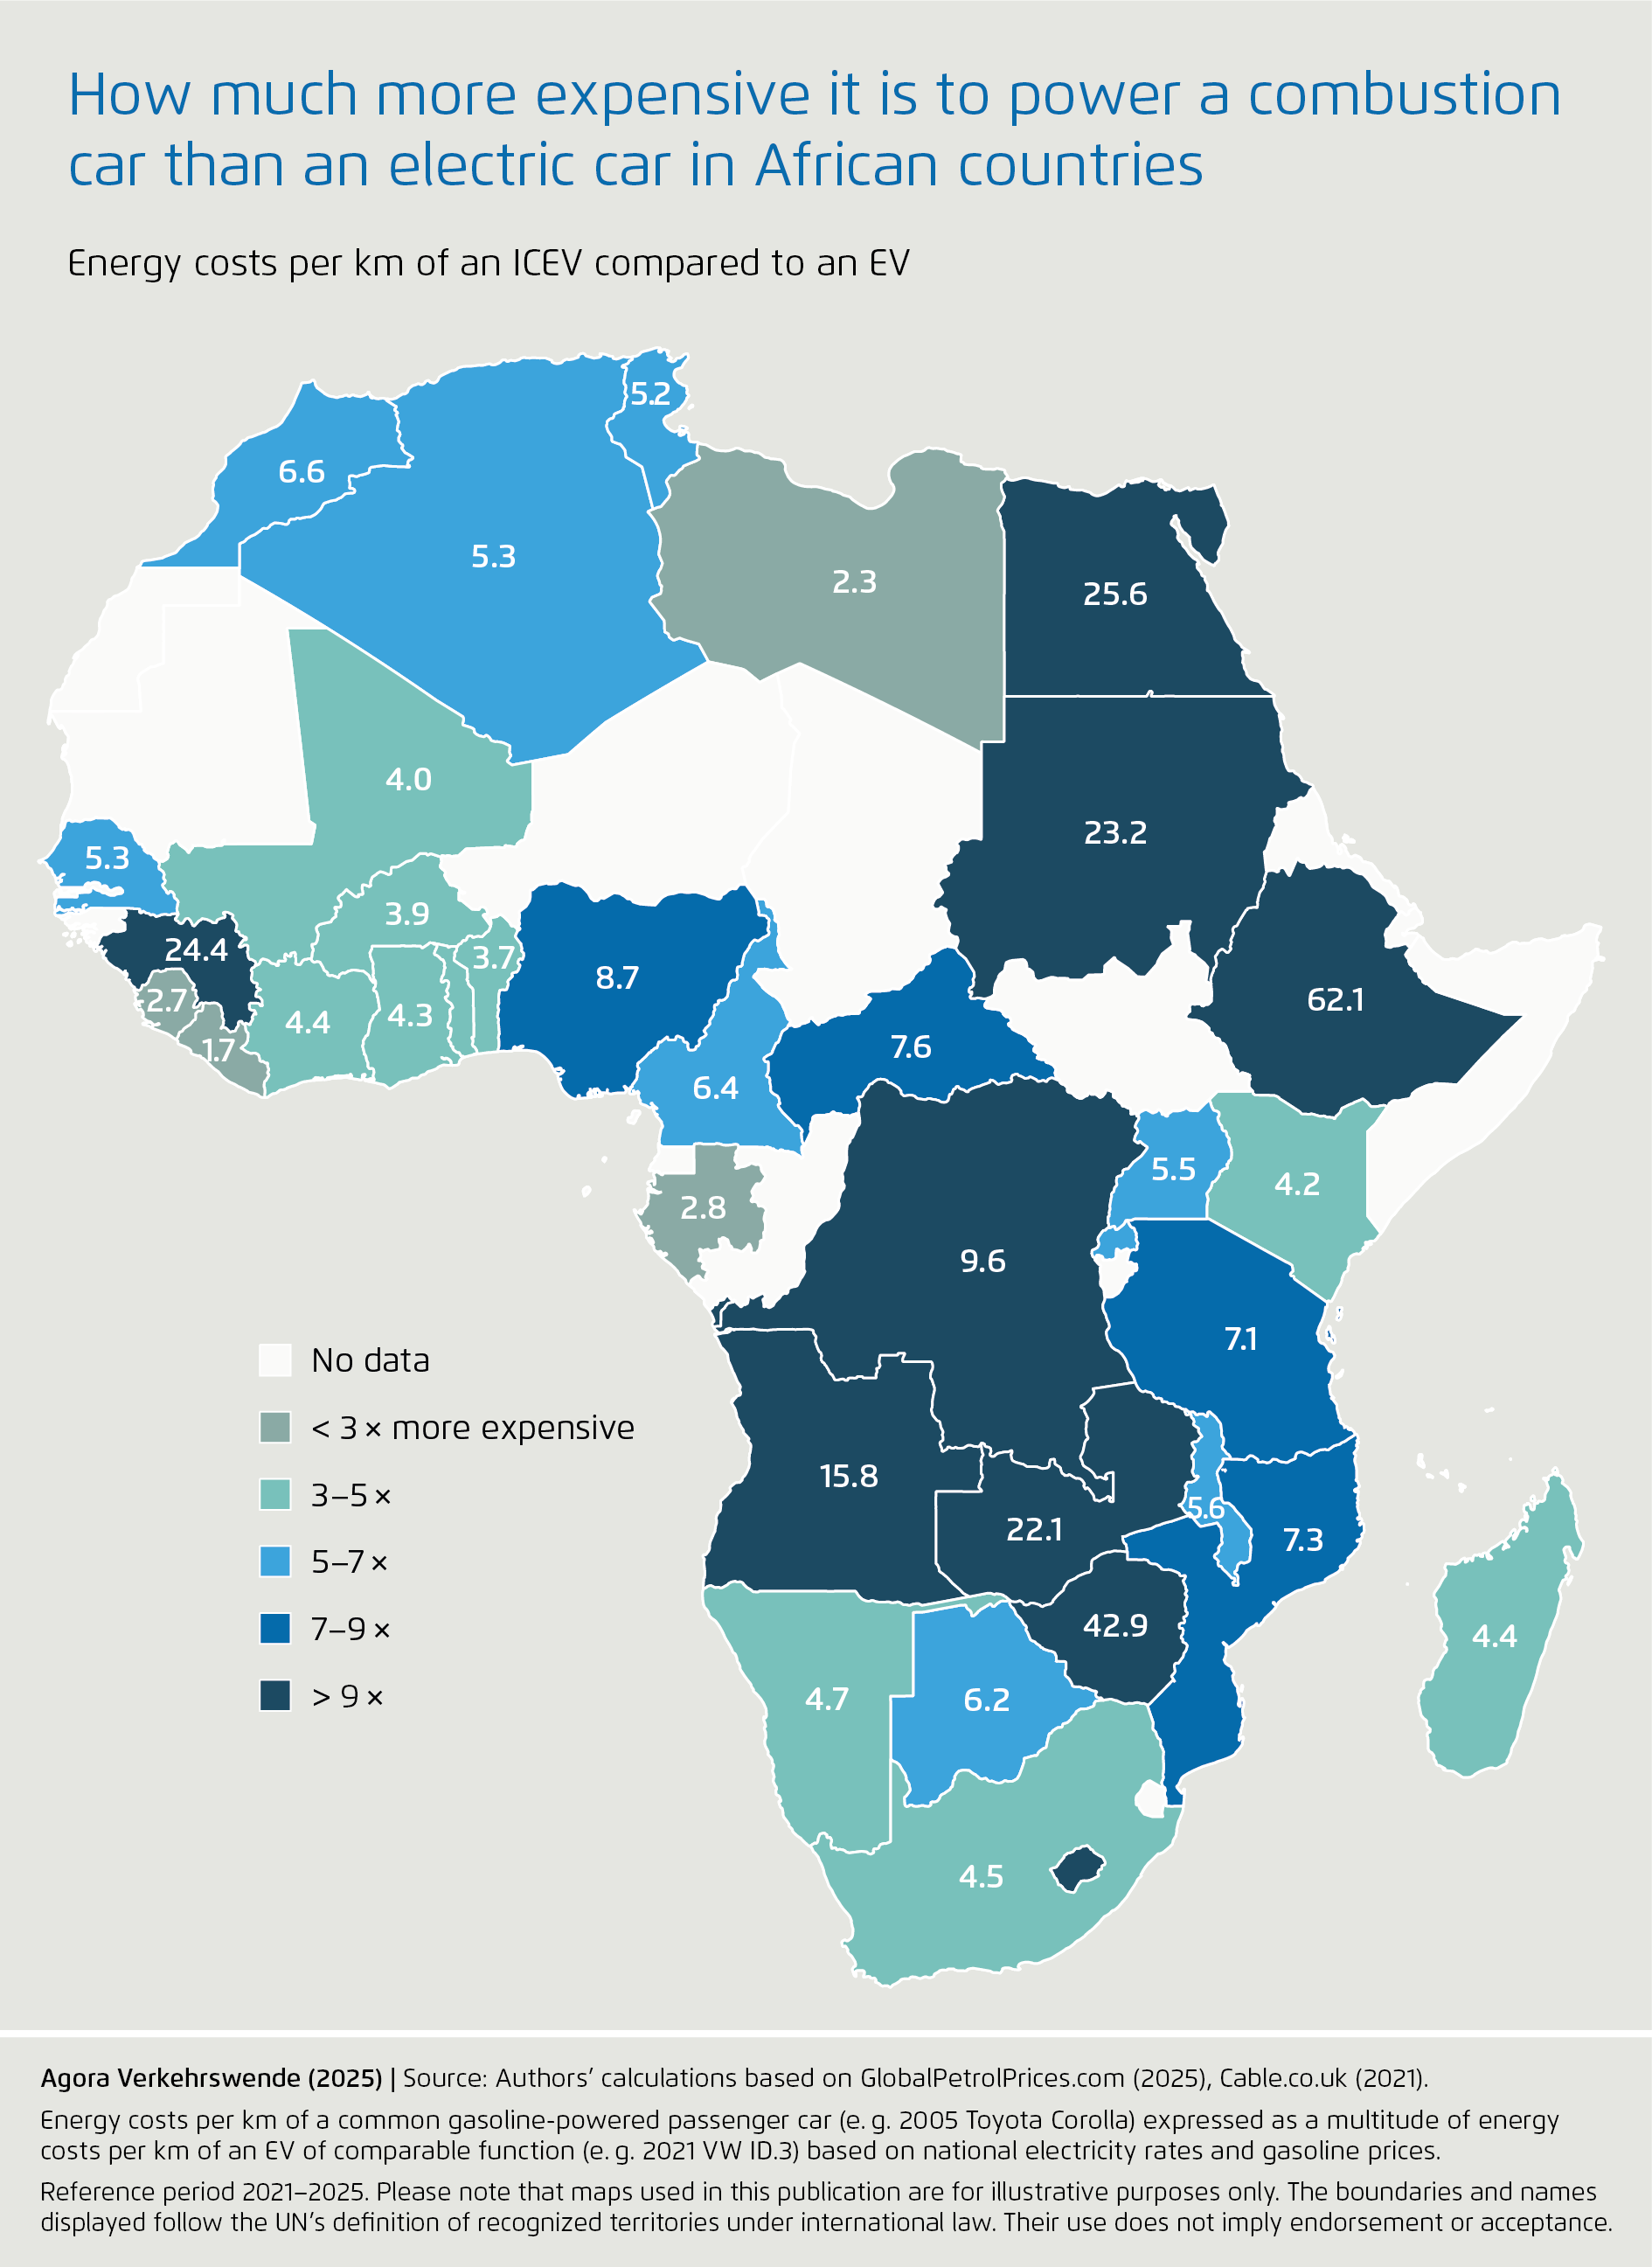
How much more expensive it is to power a combustion car than an electric car in African countries
Download:
Share:
Infographics on the energy cost savings of switching to e-mobility for national budgets and consumers
African countries have enormous potential to reduce dependence on fuel imports by taking advantage of their domestic renewable energy sources. Fully tapping this potential requires a transformation to cleaner transport based on electric vehicles as well as shared and active mobility. The following infographics of Agora Verkehrswende illustrate country-specific expenditures on fuel imports for road transport and compare the energy cost differences for vehicle users between using combustion and electric cars. Our methodology is explained at the end of this webpage.
Africa spends a greater share of income on road fuel imports than the rest of the world. Our calculations show that amongst the 33 African countries for which data are available, median import expenditures for gasoline and diesel used in road transport[1] amount to 3.6 percent of GDP. This is higher than in any other region of the world, and significantly above the global median of 2.1 percent. At the same time, access to transport in many parts of Africa is more restricted than in the rest of the world according to a range of indicators (including access to public transport, access to all-weather roads, motorization rates, and transport poverty).[2] The burden imposed by high fuel import costs is one element of the equation. Fuel import costs have a direct impact on price levels in the economy, including the affordability of transport services. In this connection, governments across Africa often seek to cushion the impact of high transport costs by subsidising fuel purchases. However, this reduces the fiscal space for other investments, including measures to improve transport services and infrastructure. In this way, Africa’s ability to invest in sustainable socio-economic development is impaired by high fossil-fuel import bills.
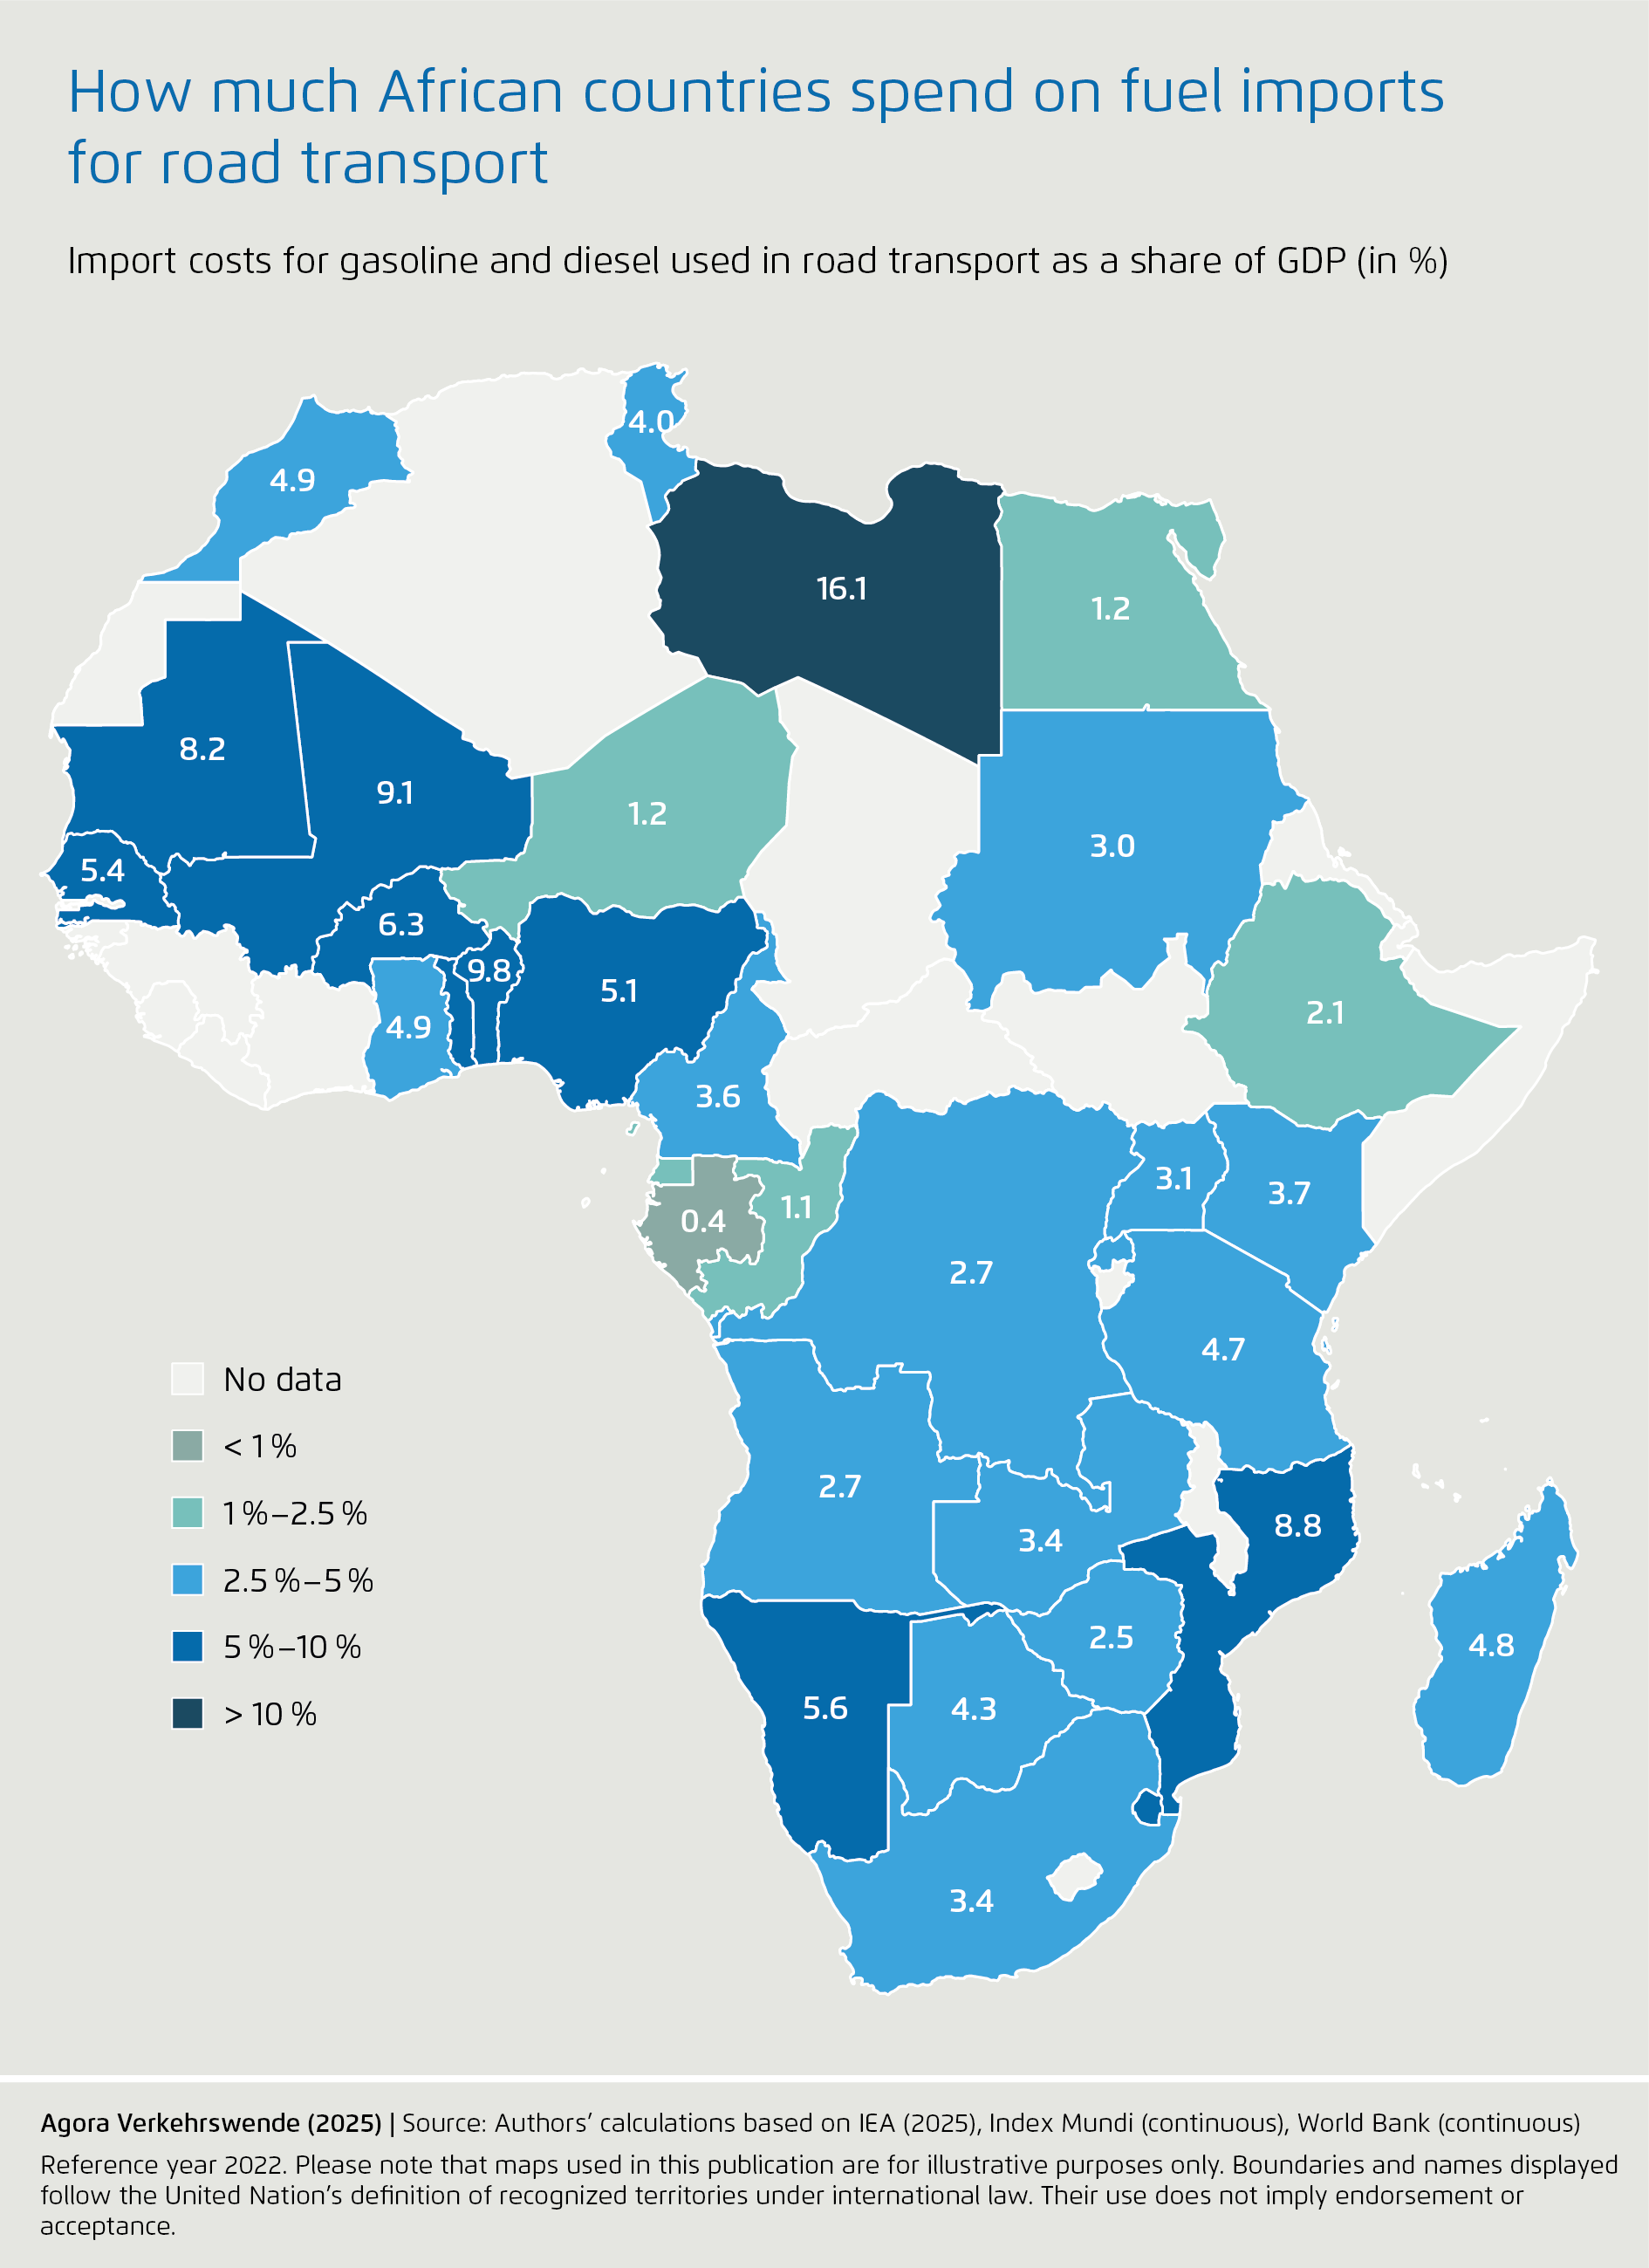
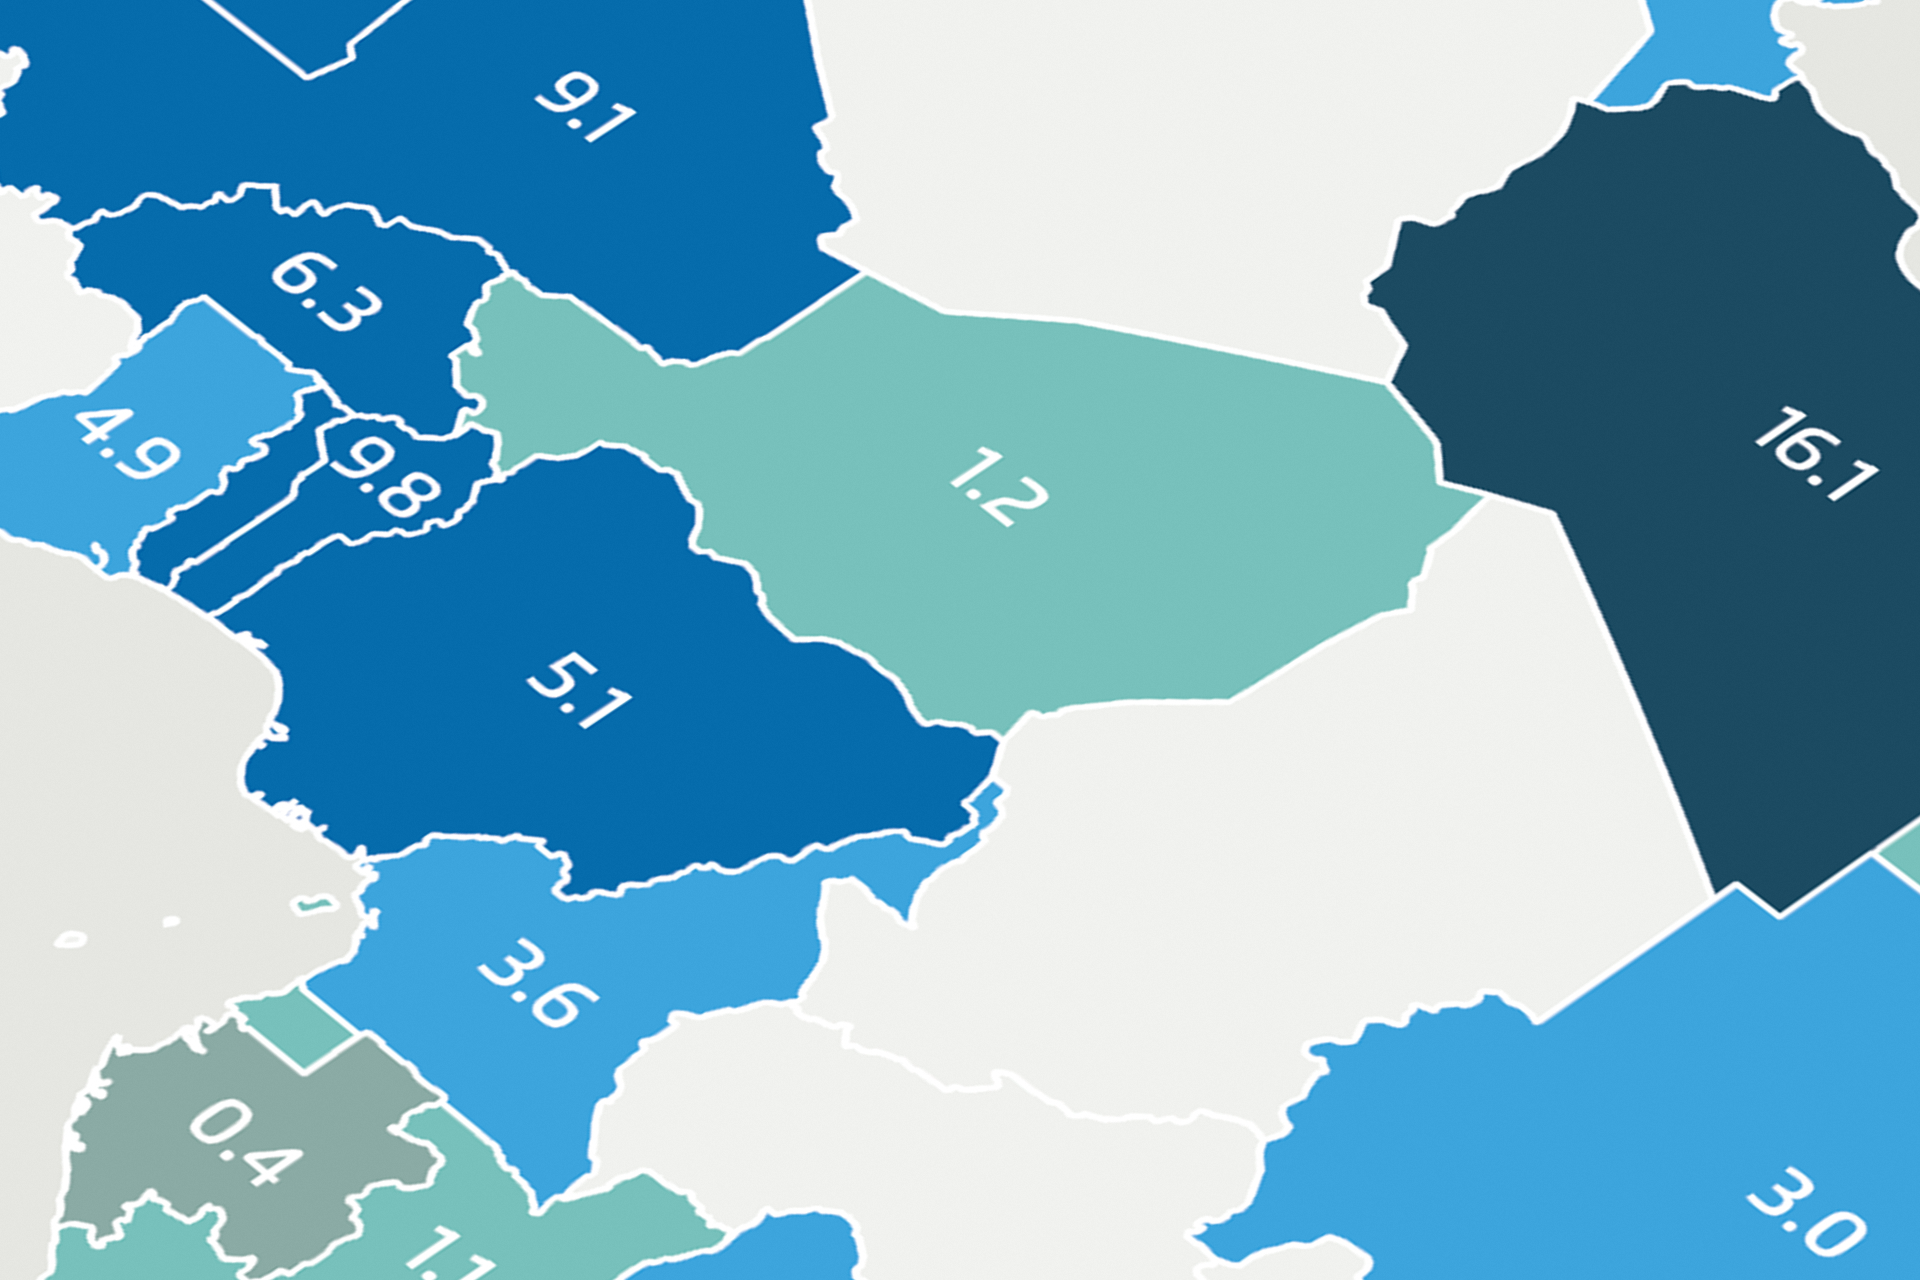
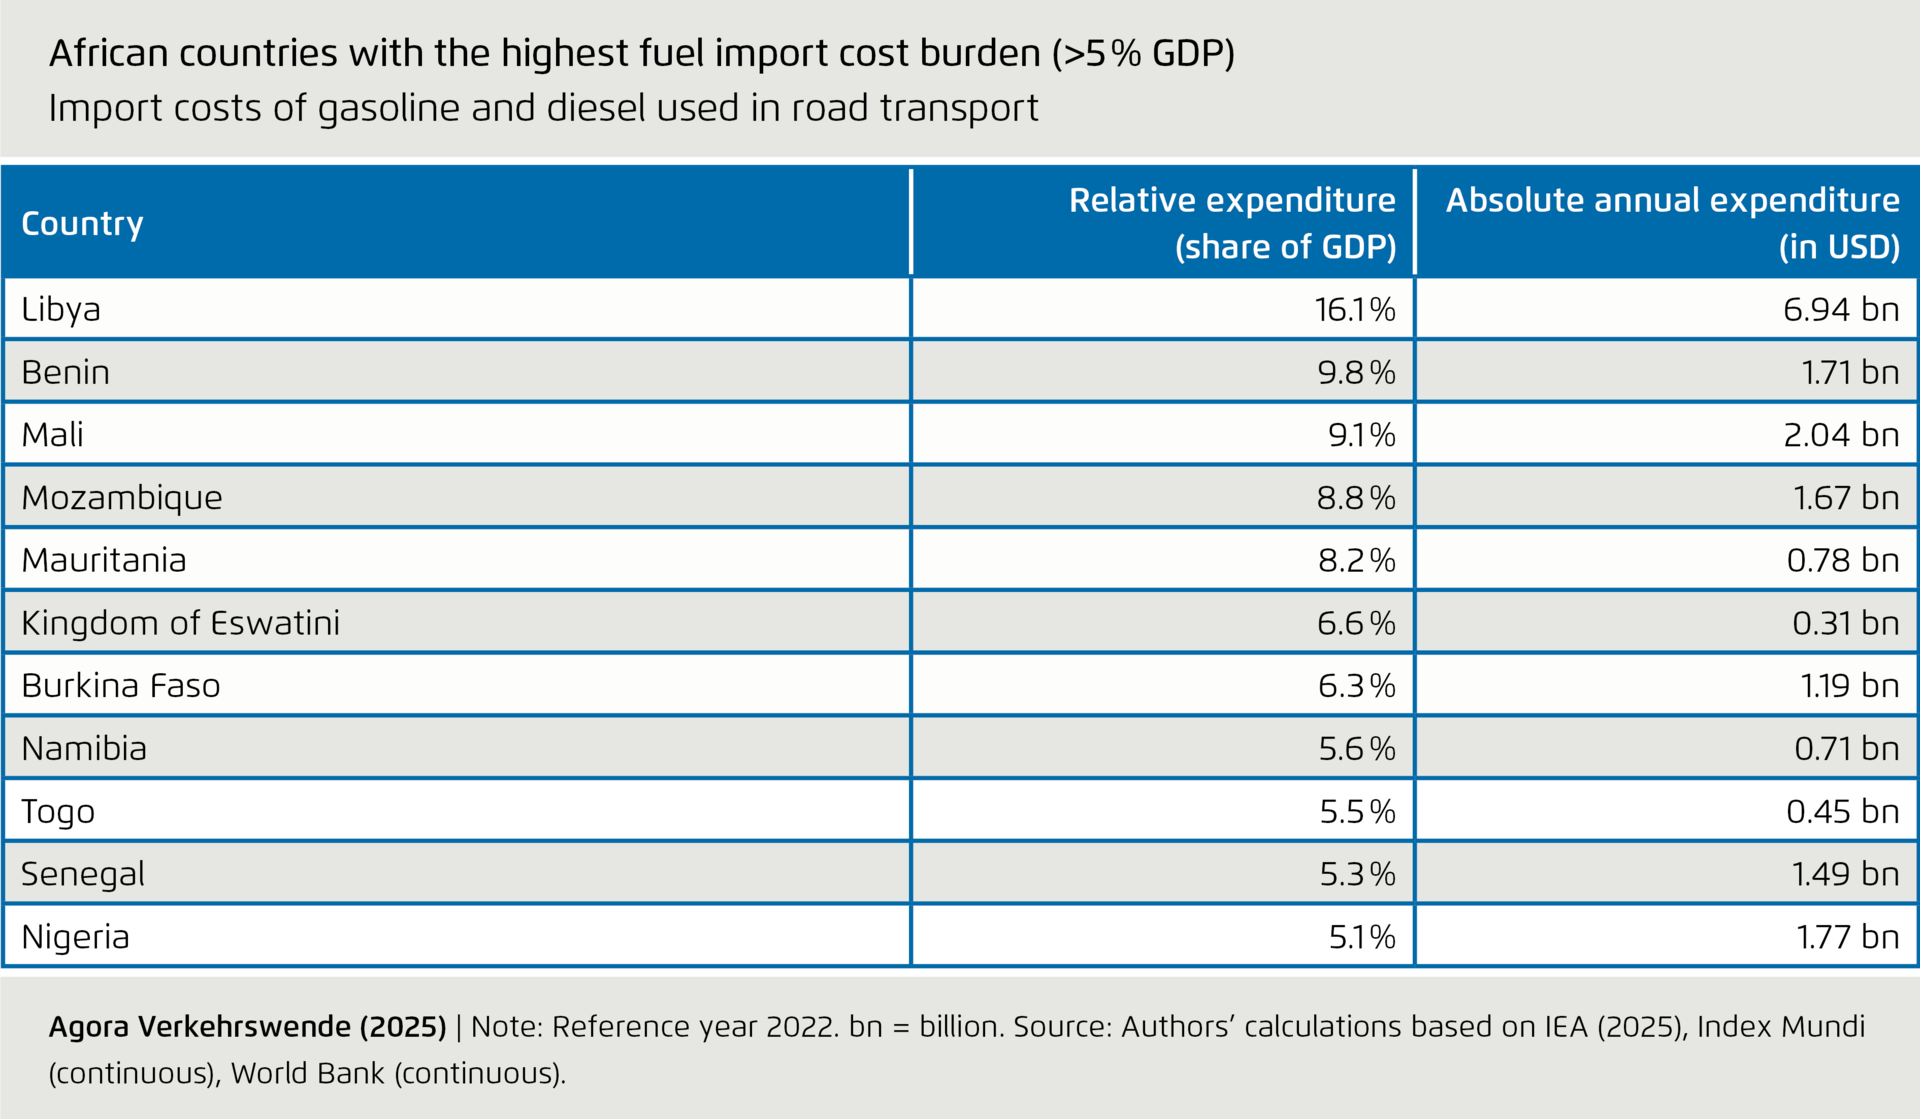
Eleven African countries spend more than five percent of GDP on gasoline and diesel imports (see table below). This is a level similar to median African government spending on health (5.1% in sub-Saharan Africa)[3] or education (4.0%).[4] While gasoline import exposure is significant in some countries – including in Libya (12.1% of GDP) and Benin (6.9% of GDP) – diesel imports impose a greater financial burden. Median African spending on gasoline imports as a share of GDP is 1.3%, compared to 2.1% for diesel. In Mauritania, Mozambique, and Mali, diesel imports alone account for more than 5% of GDP. Libya is an outlier, with an exceptionally high combined gasoline and diesel import bill equal to 16.1% of GDP, making it not only the country with the highest share in Africa but also the second highest globally (following the small island developing state of Curaçao). This high share can be explained by domestic policy choices, including the promotion of widespread private vehicle ownership (480 vehicles per 1 000 inhabitants, the highest in Africa)[5] in combination with high fuel subsidies. The combined value of gasoline and diesel imports as a percentage of GDP is lowest in Gabon (0.4%), followed by the Republic of the Congo (1.1%).
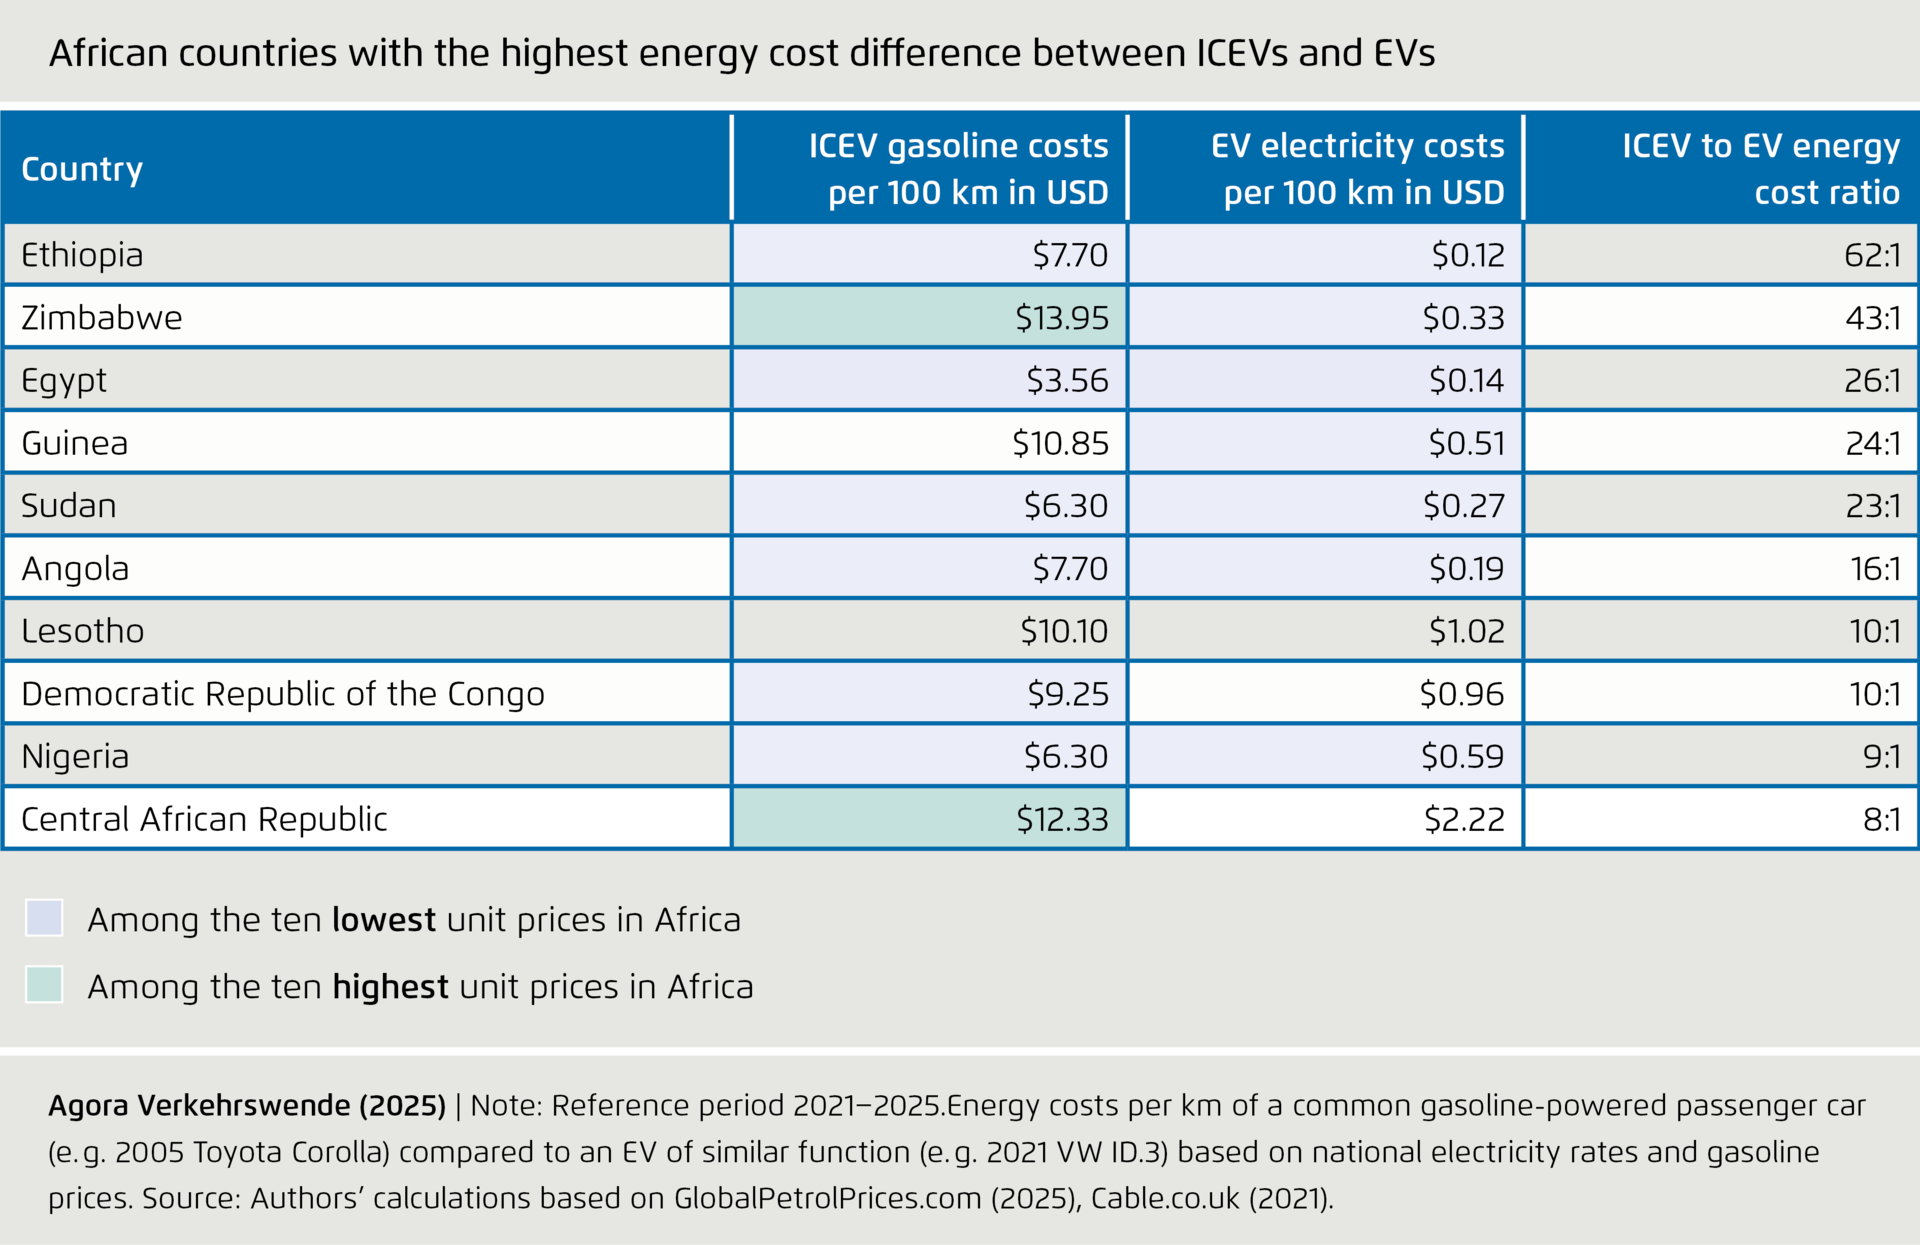
ICEVs energy costs are much higher than those of EVs in most African countries. Our calculations show that across Africa, the median energy cost difference between a gasoline-powered passenger car (internal combustion engine vehicle, ICEV) and an electric car (EV) stands at 5.5 to 1. This means that, at the median, ICEVs energy costs are more than five times that of EVs over a given distance (see at the end of this webpage an explanation of the methodology). One main reason for the competitive edge enjoyed by EVs is their energy efficiency: The direct use of electricity in battery electric vehicles is the most efficient energy option, as it largely outperforms energy conversion in internal combustion engines; EV efficiency is further bolstered by features such as regenerative braking.[6] The other main reason is the different price levels between gasoline and electricity in most parts of Africa.
Electricity prices are the primary determining factor. Electricity rates in the three countries with the highest prices (Guinea-Bissau, Comoros, Cape Verde: all above 0.30 USD/kWh) are 30 times higher than in the three countries with the lowest rates (Egypt, Ethiopia, Libya: all below 0.01 USD/kWh). Even excluding small and island nations, countries such as Kenya, Côte d’Ivoire, and Senegal have electricity prices that are 19 times higher than those of their lowest-price counterparts. By contrast, gasoline prices in the three countries with the highest prices (Central African Republic, Senegal, Zimbabwe: all above 1.50 USD/l) are less than five times more expensive than those in the three countries with the lowest gasoline prices (Angola, Algeria, Egypt: all below 0.40 USD/l) – excluding Libya, with its extremely low 0.03 USD/l. As a consequence, the countries with the lowest electricity prices are also those in which EVs offer the largest cost advantage; nine of the ten countries with the lowest electricity prices figure among the ten countries with the highest energy cost difference between ICEVs and EVs (see table below). Conversely, of the ten countries with the highest gasoline prices, only the Central African Republic and Zimbabwe rank among the top ten countries with the greatest difference between ICEV and EV energy costs.
Much of Africa has favourable conditions for power generation from renewables. The African continent is home to 60% of the global locations with the best solar energy potential,[7] and also has excellent conditions for wind, hydro, and geothermal power. As a result, various countries – including Ethiopia, Kenya, and the Democratic Republic of Congo – already have renewables shares of over 90% in power generation.[8] What is more, electricity is largely produced and consumed locally, meaning prices are determined at the local level and take into account local cost and price factors. This is the reason why electricity prices vary significantly between countries.
Fossil fuels, by contrast, are predominantly traded and shipped internationally, with global markets setting prices based on benchmark rates, largely disconnected from local cost and price factors.[9] Furthermore, global oil prices are determined to great extent by a small number of countries that dominate production. Several African countries, including Nigeria, Libya, and Angola, have significant oil reserves and production capacities. However, their refinement capacities are limited, forcing them to export crude oil and then import internationally refined gasoline and diesel at a surcharge.
There are two complementary approaches for reducing oil consumption in transport:
First, one can reduce energy demand by improving efficiency in the transport system, e.g. by promoting active and shared modes of transport, discouraging unnecessary trips, and improving vehicles and technologies (thus ushering in a “mobility transition”).
Second, one can substitute demand for fossil fuels with energy from renewable sources, e.g. through the direct electrification of vehicles and, in the case of hard-to-abate transport modes, reliance on sustainably produced renewable fuels (thus ushering in an “energy transition in transport”).
Large sections of the population in many African countries lack access to adequate transport options. This is an issue that requires particular attention. Reducing fuel consumption in road transport must therefore go hand in hand in improving access to high-quality transport options.
Low – yet rapidly increasing – levels of motorization in most African countries present a unique opportunity for leapfrogging to EVs. The near-term market uptake of EVs can reduce and even reverse the growth of oil consumption and associated greenhouse gas emissions while also avoiding higher future costs of transformation. Specifically, broad-based EV adoption can enable countries to leapfrog technologically past the age of the combustion engine vehicles directly to a future based on EVs and shared and active mobility. As of 2024, EVs are saving between 1.3 million (IEA) and 1.8 million (BloombergNEF) barrels of oil consumption per day worldwide, making them a powerful tool for promoting oil substitution.[10]
Transitioning to cheaper and cleaner transport in African countries will depend on leveraging affordable electricity and introducing sound policies for EV adoption. More and more African countries are already creating comprehensive regulatory frameworks for electric mobility: for example, by reducing import duties for electric vehicles, by setting long-term goals for the transformation to electric mobility, or by banning the import of new and used combustion engine vehicles. European governments like that of Germany, in turn, should encourage companies to invest and engage in collaborative projects.
This section outlines the methodology employed to calculate the financial burden of imported gasoline and diesel used in the transport sector, expressed as a percentage of national gross domestic product (GDP) for the reference year 2022.
Data sources:
Fuel import data: Import and consumption volumes for transport fuels were sourced from the IEA’s World Energy Statistics. Our analysis focused on two main road transport fuels: motor gasoline and gas/diesel oil (excluding biofuels).
Economic data: GDP figures in current US dollars were obtained from the World Bank’s World Development Indicators database.
Fuel price data: Wholesale spot prices for gasoline and diesel were obtained from Index Mundi, which aggregates data from primary commodity markets. US benchmark prices provide a consistent market-based value for international comparison. The following annual average 2022 spot prices were used:
Gasoline: $3.29 per gallon (LA RBOB Regular benchmark)
Diesel: $3.71 per gallon (NY Harbor ULSD benchmark)
Calculation
A. Volume of fuel imports used in road transport
For each country, the volume of fuel imports destined for road transport was estimated by applying the national transport sector’s share of fuel consumption to the total import volume. This approach accounts for the fact that imported fuels are distributed across various sectors (e.g. agriculture, industry, residential), adjusting the import cost burden accordingly. As the share of motor gasoline and gas/diesel oil used in modes of transport other than road transport (e.g. maritime and rail) is minimal and no data was available on the share of motor gasoline and gas/diesel oil used specifically in road transport, the share of transport was used as a proxy for the share of use in road transport.
B. Transport fuel import cost
The estimated import volumes for gasoline and diesel were valued using their respective benchmark prices and summed to yield total annual import costs.
C. Comparison to GDP
Transport fuel import values were placed in relation to each country’s 2022 GDP and expressed as a percentage. This ratio serves as the key indicator for comparing the relative financial impact of imported transport fuels across different countries. One caveat pertains to data quality and comprehensiveness, both for GDP and fossil fuel imports. GDP numbers reflect best-guess estimates due to known coverage issues, including in particular non-coverage of informal sectors, which make up significant share of the economy in many countries. The comprehensiveness of fuel import databases differs between countries, as grey markets exist alongside official registries, particularly in landlocked countries. To an extent, both factors may balance each other out, as countries with less accurate import registries tend on average to also have less complete GDP data – and vice versa.
This section outlines the methodology employed to calculate the cost difference between powering an electric passenger car and an internal combustion engine passenger car, expressed as a ratio of ICEV to EV energy costs.
Data sources:
Calculations
A. Electricity rates
To compare the energy costs of ICEVs relative to EVs, we used national electricity rate and gasoline price data, which we multiplied by the consumption required to drive one-hundred kilometres. Electricity rate data for 32 countries were obtained from GlobalPetrolPrices.com, which provides a two-year national average (2023–2025), broken down by business and residential rates. As regulations differ for EV charging– with some countries showing higher rates for businesses than for household consumers – and in the absence of comprehensive data on charging tariffs, we used the average for each country between the respective business and residential rates. We drew on 2021 data from a British price comparison portal (Cable.co.uk) estimate missing figures for 19 countries without entries in this dataset, after cross-checking entries for coherence. No data were available for countries including Eritrea, Somalia, and South Sudan. All prices are given in nominal US dollars.
B. Gasoline prices
For fuel prices we restricted the calculation to gasoline-powered vehicles, which generally make up the majority of (passenger car) vehicle fleets. We obtained gasoline prices for 40 countries from GlobalPetrolPrices.com, using 8 September 2025 as our reference date. No data were available for at least 14 countries. All prices are given in nominal US dollars.
C. Vehicle consumption
The assessment of consumption is limited to the segment of passenger cars, which make up the largest or second-largest share of the vehicle fleet in virtually all African countries. Across the continent, imported used vehicles make up more than 60 percent of vehicles added to the fleet annually.[11] However, this share varies greatly by country, as five countries currently have a complete ban on used (ICE) vehicle imports (Ethiopia, Egypt, South Africa, Seychelles, Sudan). At the other end of the spectrum, 97% of newly registered cars in Kenya are imported used vehicles. Among the countries that allow used-vehicle imports, regulations differ widely, not least concerning vehicle age and emission standards: 20 countries in Africa (as of 2020) place a maximum age limit on imported used vehicles. However, this age limit is typically not very strict; only seven countries (Algeria, Chad, Côte d’Ivoire, Gabon, Mauritius, Morocco, Tunisia) require vehicles to be no older than five years.[12] Aside from divergent regulatory standards, an additional issue in some countries is the presence of grey imports that escape data collection.
Reliable publicly available data on vehicle imports are scarce in many countries; this problem is even more acute in the area of fleet composition. Therefore, we rely on estimates for the average age of vehicles at the time of import and for the average age of vehicle fleets. We assume an average age of 15 years or less for newly registered vehicles. For vehicles in use, we assume an average age of 20 years (“fleet average”). Electric vehicles achieved a significant share in global automotive production only around 2020. It would therefore be counterfactual to assume that EVs are of a similar age as ICEVs at the time of registration: Purchasing an electric vehicle in Africa almost inevitably means purchasing a newer vehicle. Only in the handful of countries with used vehicle import bans can ICEVs and EVs be assumed to have a similar age at the time of purchase.
We calculated estimates for energy consumption based on passenger car models common on many African streets – although there is great variation between countries. Specifically, our calculations are based on compact-class sedans or hatchbacks with relatively small engines/modest power output. Vehicle specs are as follows:[13]
For average in-fleet consumption:
For comparison: average consumption of first time locally registered ICEVs:
For average consumption of EVs (no significant difference between in-fleet and newly registered):
Although most of Africa’s population (55%) lives in rural areas,[14] it can be reasonably assumed that cars have a higher share of urban use than in other parts of the world. This is because across the African continent, motorization rates are significantly higher in urban areas than in rural ones (a relationship that does not hold true in advanced economies). Infrastructure is a major limiting factor, as only one third of rural inhabitants have access within two kilometres to an all-season road.[15] Shared transport also plays a major role in Africa; accordingly, we can assume a significant share of passenger cars are used for shared transport (including popular and artisanal transport); indeed, in some countries, the majority of passenger cars are shared.[16]
We thus estimate in-fleet consumption at 9 l/100 km – closer to the stated urban consumption, but still below the estimate of 10.8 l/100 km provided by MobiliseYourCity for artisanal taxi service cars.[17] Electric vehicles do not experience the same increase in consumption in urban areas – if anything, consumption is lower in urban settings. Our estimate for EV energy consumption is 15.5 kWh/100 km. We have not adjusted for additional differences between energy consumption as measured in different test cycles and real-world conditions.
As mentioned, five countries have imposed a complete ban on used ICE vehicle imports and an additional five countries have a five-year age limit on used-vehicle imports. As a consequence, late-model ICEVs should be used for the purpose of comparison. However, even though engines have become more efficient, these gains have been more than offset by increases in motor power and vehicle size/weight. The most recent Toyota Corolla XII model, for example, has a combined fuel efficiency of 5.7–6.1 l/100 km – i.e. marginally below the estimate for a 15-year-old used vehicle.
As fuel consumption data for different use cases across Africa remain incomplete (i.e. freight, taxi, 2/3Ws), the estimates for energy costs hinge on underlying assumptions regarding fuel consumption. Therefore, expanding the assessment of energy costs to more vehicle segments beyond passenger cars would provide little additional insight. Differences between segments may result from divergent underlying assumptions as well as factual differences in energy consumption. For heavy-duty vehicles, the use of diesel as primary fuel is an additional factor to be taken into account.
[1] All further mention of “gasoline and diesel” refers specifically to their use in road transport
[2] Slocat 2025, Porter et al. 2020
[3] World Bank 2022
[4] TheGlobalEconomy 2021
[5] OICA 2020
[6] Agora Verkehrswende 2017
[7] IEA 2023
[8] Ember (continuous)
[9] US EIA 2024
[10] IEA 2025, Bloomberg 2024
[11] UNEP 2020
[12] UNEP 2024 – cross-checked with FIA 2020, JapaneseCarTrade.com (continuous), UNECE 2022, UNEP 2020,
[13] All vehicle data based on Auto-Data.net (continuous)
[14] UNECA 2024
[15] World Bank 2010
[16] MobiliseYourCity 2022
[17] MobiliseYourCity 2025
Agora Verkehrswende (2017). Transforming Transport to Ensure Tomorrow’s Mobility. https://www.agora-verkehrswende.org/publications/transforming-transport-to-ensure-tomorrows-mobility-3
Auto-Data.net (continuous). https://www.auto-data.net/en/
BloombergNEF (2024). Oil Faces a Demand Issue. Biggest User Segment to Peak in 2027. https://about.bnef.com/insights/clean-energy/oil-faces-a-demand-issue-biggest-user-segment-to-peak-in-2028/
Cable.co.uk (2021). Global electricity pricing study. www.cable.co.uk/energy/worldwide-pricing/
FIA (2020). Promoting Safer and Cleaner Used Vehicles for Africa. www.fiaregion1.com/promoting-safer-and-cleaner-used-vehicles-for-africa/
Ember (continuous). Yearly Electricity Data. https://ember-energy.org/data/yearly-electricity-data/
Enerdata (2024). Beyond the barrel: kicking oil’s dominance. https://www.enerdata.net/publications/executive-briefing/global-oil-market-trends.html
GlobalPetrolPrices.com (2025). Electricity prices. www.globalpetrolprices.com/electricity_prices/
GlobalPetrolPrices.com (2025). Gasoline prices. www.globalpetrolprices.com/gasoline_prices/
IEA (2023). Africa Energy Outlook 2022. www.iea.org/reports/africa-energy-outlook-2022
IEA (2025). Global EV Outlook 2025 – Expanding sales in diverse markets. https://www.iea.org/reports/global-ev-outlook-2025
IEA (2025). World Energy Statistics. www.iea.org/data-and-statistics/data-product/world-energy-statistics
Index Mundi (continuous). Commodity Prices. www.indexmundi.com/commodities/
JapaneseCarTrade.com (continuous). Used Car Import Procedure and Regulations. blog.japanesecartrade.com/import-regulations/
MobiliseYourCity (2022). MobiliseYourCity Global Monitor 2022. https://www.mobiliseyourcity.net/global-monitor-2022
MobiliseYourCity (2025). How to integrate paratransit data into GHG emissions calculations? – A
methodological note based on the MobiliseYourCity´s MRV framework and GHG Emissions Calculator. https://www.mobiliseyourcity.net/how-integrate-paratransit-data-ghg-emissions-calculations-methodological-note-based
OICA (2020). Total World Vehicles in Use. https://oica.net/total-world-vehicles-in-use-2020/
Porter, G., Abane, E., Lucas, K. (2020). User Diversity and Mobility Practices in Sub-Saharan African Cities: Understanding the Needs of Vulnerable Populations – The State of Knowledge and Research. Gothenburg, Sweden: Volvo Research and Educational Foundation. https://vref.se/wp-content/uploads/2024/01/Porter-et-al-2020-User-diversity-and-mobility-practices-in-Sub-Saharan-African-cities-VREF.pdf
Slocat (2025). Transport, Climate and Sustainability Global Status Report 4th Edition – Africa Regional Overview. M. Msoni, G. Ankunda. https://gsr4.slocat.net/
TheGlobalEconomy.com (2021). Education spending, percent of GDP - Country rankings. https://www.theglobaleconomy.com/rankings/Education_spending/Africa/. Calculation based on UNESCO data
UNECA (2024). Africa Urbanization Portal. https://ecastats.uneca.org/african-urbanization/
UNECE (2022). Safer and Cleaner Used Vehicles for Africa. unece.org/transport/publications/safer-and-cleaner-used-vehicles-africa
UNEP (2020). Used Vehicles and the Environment – A Global Overview of Used Light Duty Vehicles: Flow Scale and Regulation. https://www.unep.org/resources/report/global-trade-used-vehicles-report
UNEP (2024). Used Vehicles and the Environment – A Global Overview of Used Light Duty Vehicles: Flow Scale and Regulation – Update and Progress 2024. https://www.unep.org/resources/report/used-vehicles-and-environment-global-overview-used-light-duty-vehicles-flow-scale
U.S. Energy Information Administration (EIA) (2024). Country Analysis Brief: World Oil Transit Chokepoints. https://www.eia.gov/international/content/analysis/special_topics/World_Oil_Transit_Chokepoints/wotc.pdf?
World Bank (continuous). GDP (current US$). https://data.worldbank.org/indicator/NY.GDP.MKTP.CD
World Bank (2010). Africa Infrastructure: A Time for Transformation. Chapter 10: Roads: Beyond the Interurban Network. https://documents1.worldbank.org/curated/en/246961468003355256/pdf/521020PUB0EPI1101Official0Use0Only1.pdf
World Bank (2022). Global Health Expenditure Database – Current health expenditure (% of GDP) - Sub-Saharan Africa. https://data.worldbank.org/indicator/SH.XPD.CHEX.GD.ZS?locations=ZG&utm