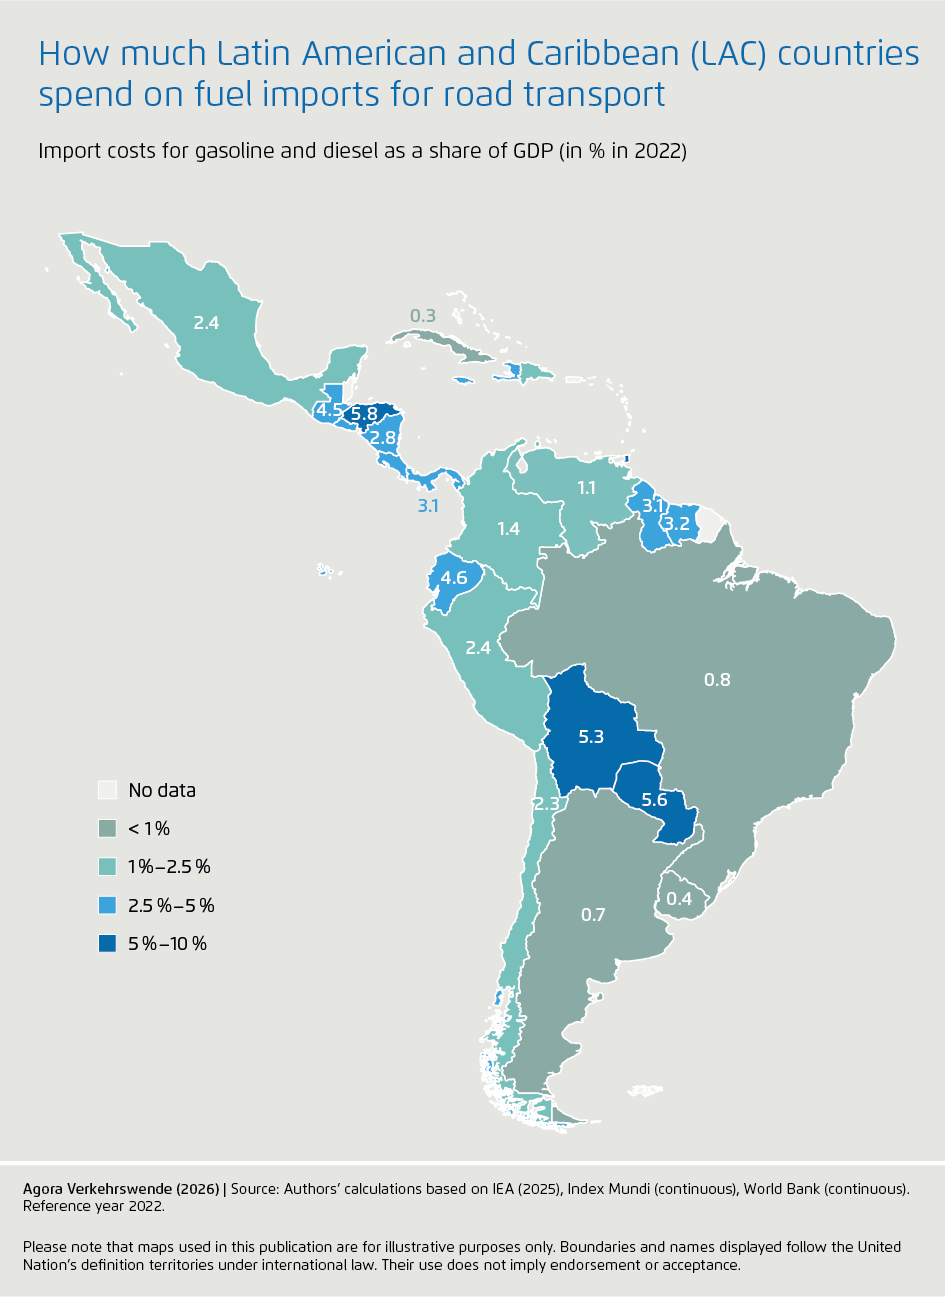
How much Latin American and Caribbean (LAC) countries spend on fuel imports for road transport
Share:
Infographics on the energy cost savings of switching to electric mobility for national budgets and consumers
Heavy reliance on imported fossil fuels for road transport leaves many Latin American and Caribbean economies highly exposed to international price volatility and external supply shocks. This creates significant economic and energy security risks directly tied to their transport systems. Countries in the region have an enormous opportunity to reduce this dependence by transforming their transport systems; the widespread adoption of electric mobility presents a particularly promising path forward. The following infographics illustrate this potential by detailing country-specific spending on gasoline and diesel imports for road transport and by comparing the energy costs of privately owned internal combustion vehicles to that of electric vehicles. Our methodological approach is explained at the end of this webpage.
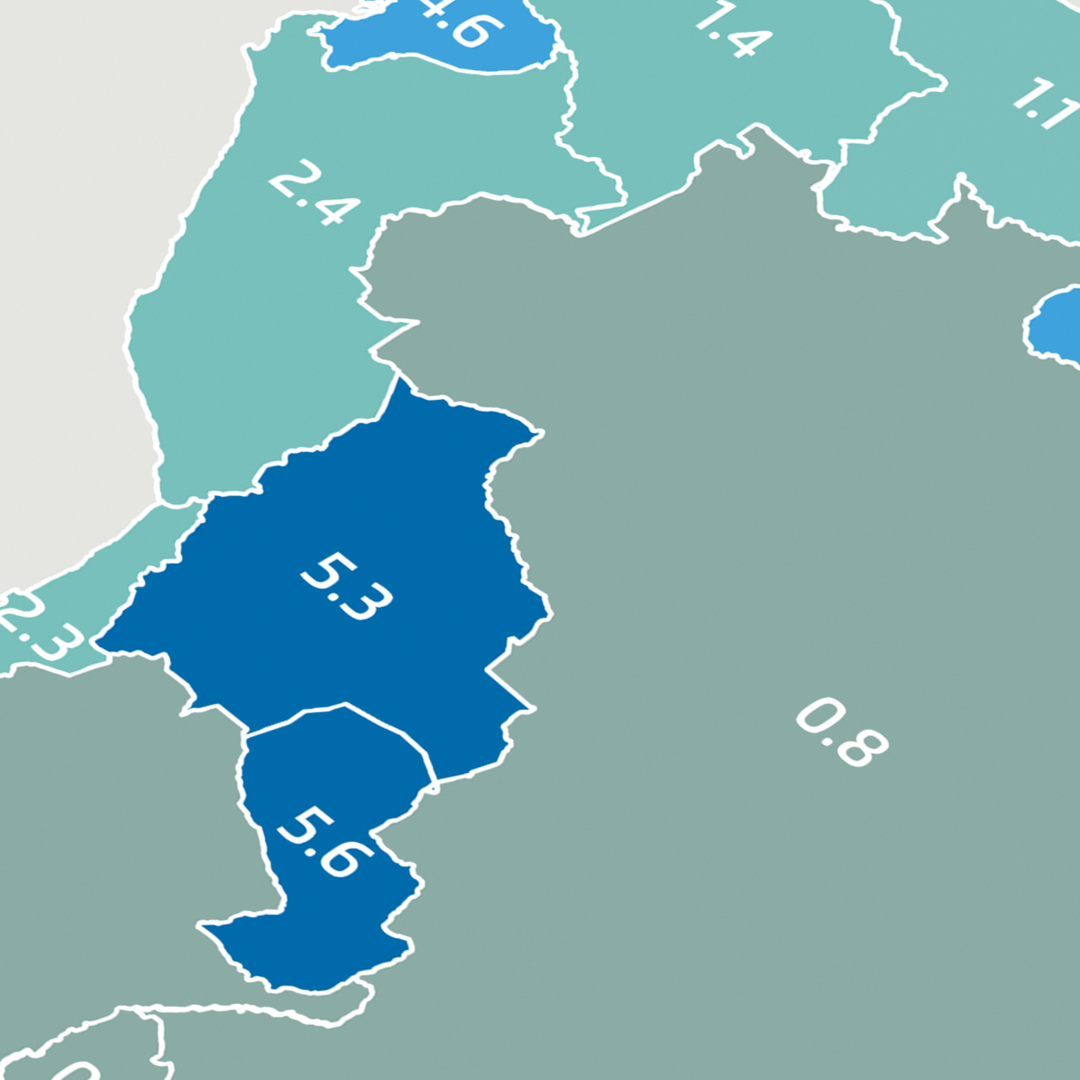
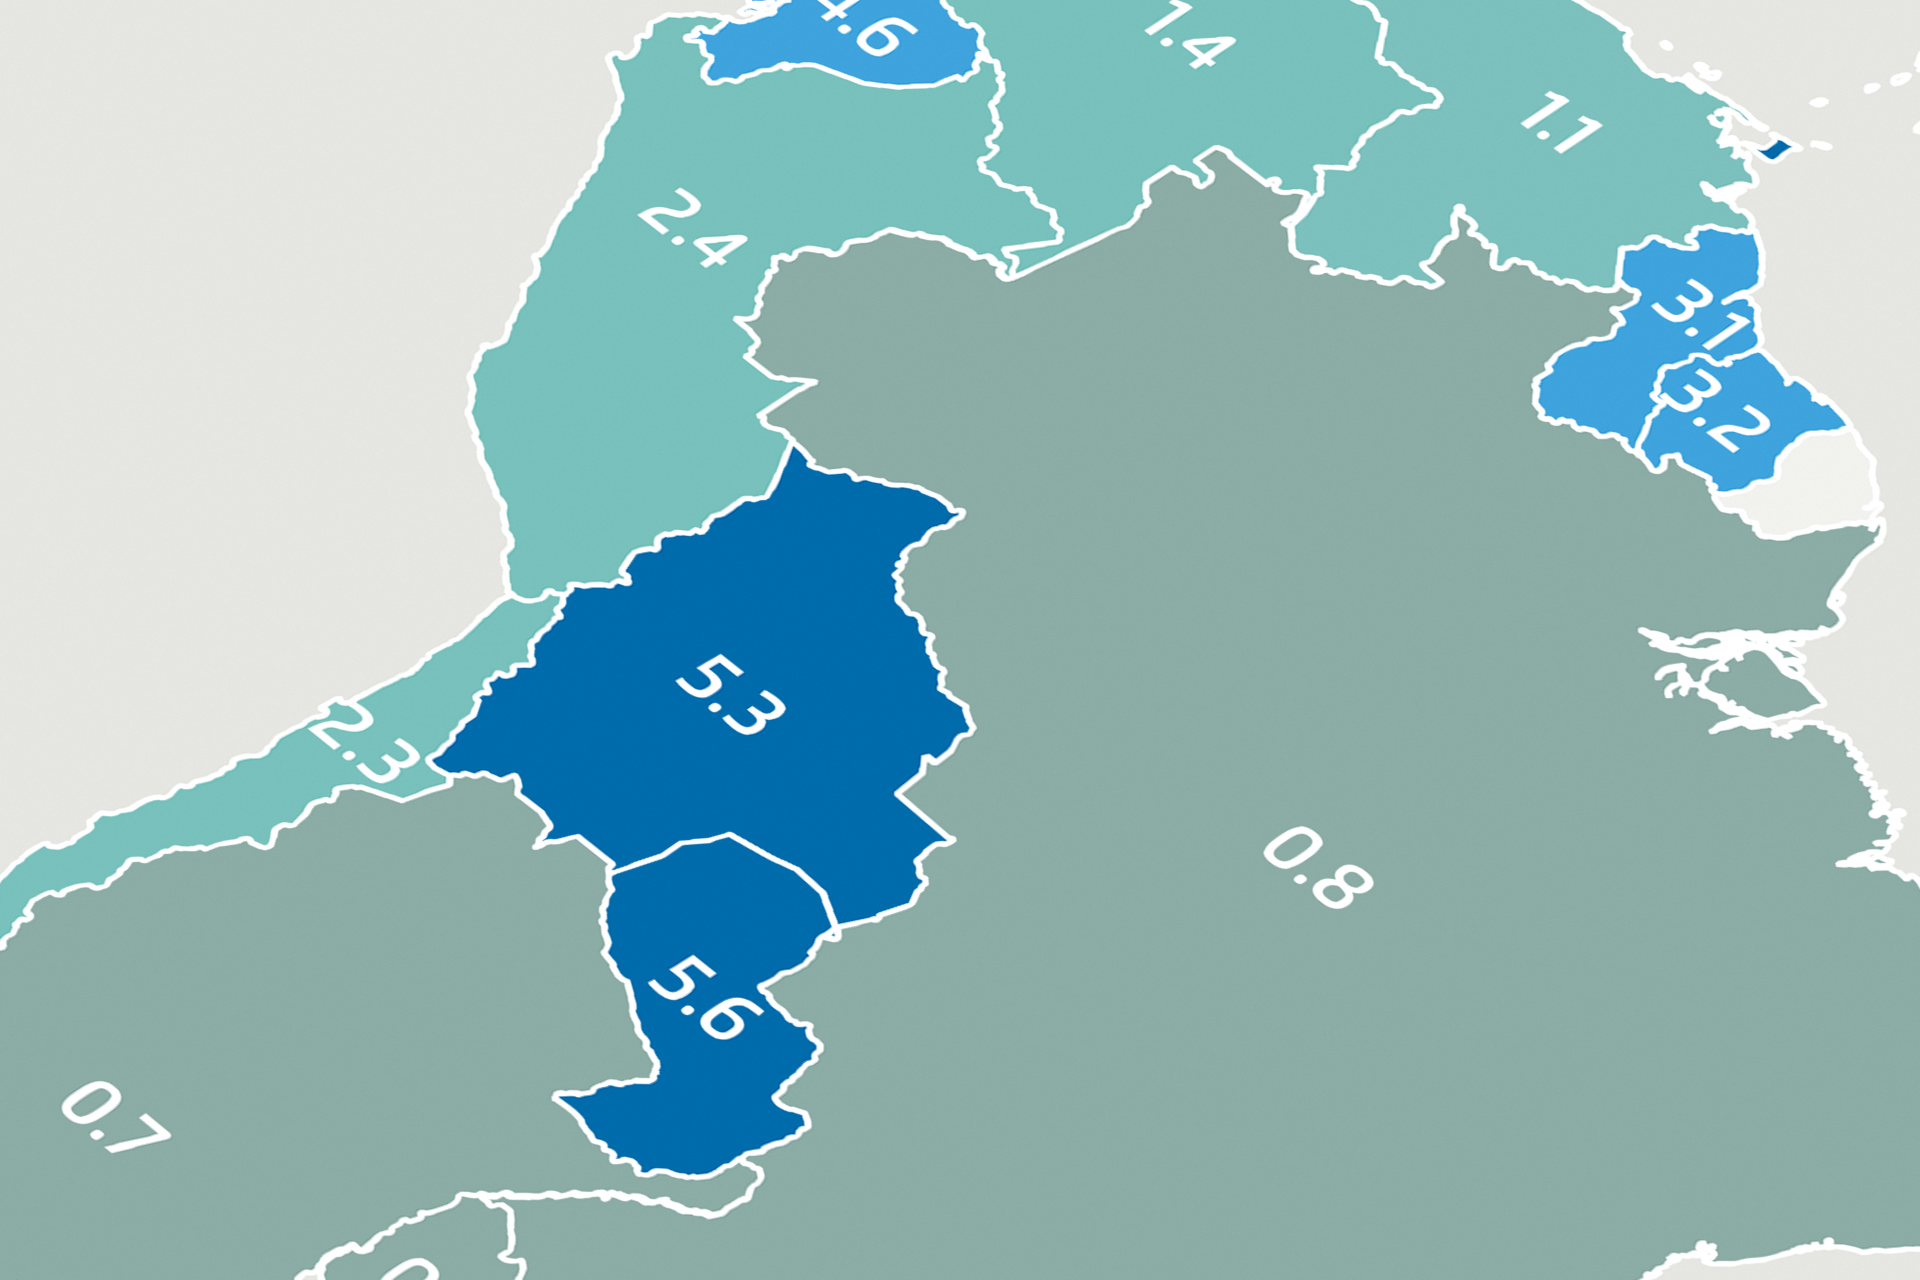
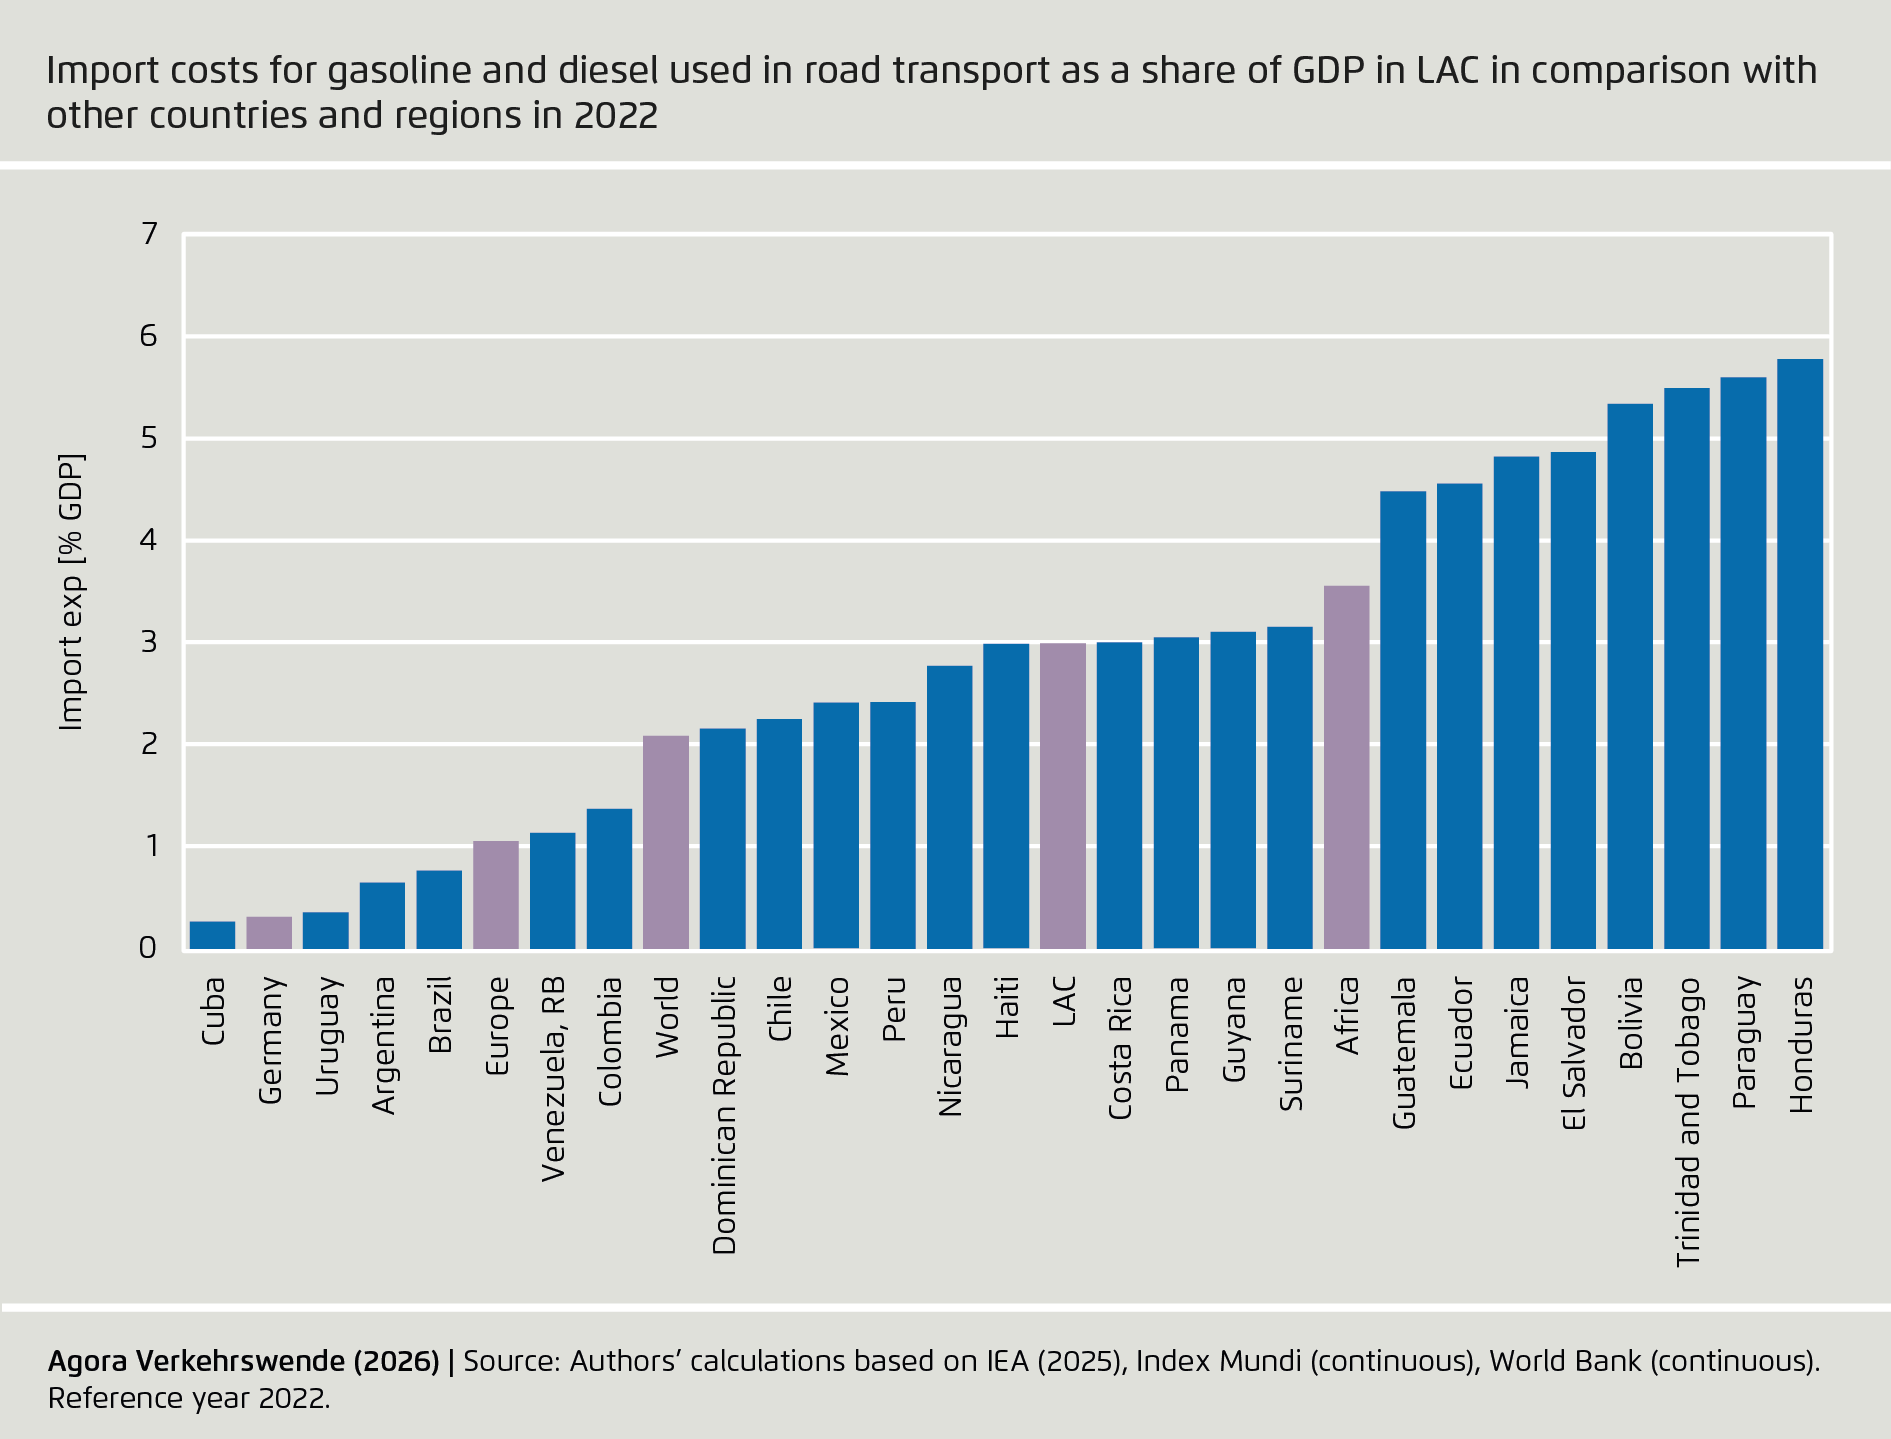
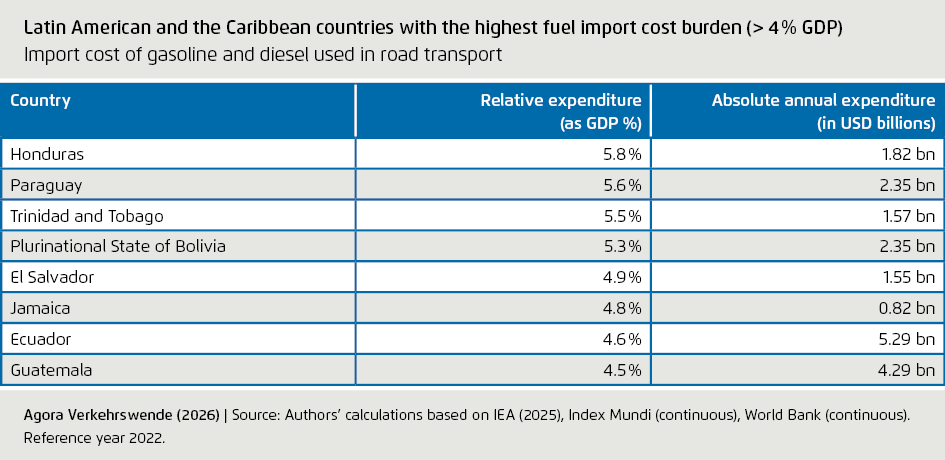
The median country in Latin America and the Caribbean spends about 3% of its gross domestic product (GDP) on imported gasoline and diesel for road transport, nearly triple Europe’s share and well above the median share globally. This level of spending is higher than what many governments in the region allocate to critical sectors such as education or health. For context, Mexico invested in 2022 approximately 3% of its GDP in health, while countries like El Salvador, Guatemala, Haiti, Panama, Paraguay, Suriname, and Trinidad and Tobago allocate less than 3.5% on education.1
Eight countries in the region spend more than 4% of GDP on imported gasoline and diesel for road transport. Honduras, Paraguay, and Trinidad and Tobago each allocate more than 5.5% of their GDP to these imports, followed closely by Bolivia (5.3%) and El Salvador (4.9%). These figures stand in stark contrast to countries like Cuba and Uruguay, where spending remains below one per-cent of GDP. The comparatively low share observed in Cuba is largely explained by structurally weak transport demand. The country has the lowest motorisation rate in the region (approx. 25 four-wheeled vehicles per 1,000 people)2, alongside structural constraints on vehicle acquisition and persistent fuel shortages, which together limit total consumption. In other countries with relatively low exposure, including Argentina (0.66%) and Brazil (0.78%), domestic refining capacity and alternative fuels play a key role. Both countries have significant local production and refining, while Argentina has also promoted the use of natural gas in transport. Brazil, in particular, stands out for its large-scale use of ethanol through its flex-fuel vehicle fleet, which reduces gasoline demand.
In an effort to mitigate the impacts that rising oil prices represent for consumers, governments across the region often subsidise fuel purchases. Some countries allocate amounts that reach 6% of GDP, as in the case of Venezuela. In other cases, such support can account for more than 3%, as in Bolivia and Ecuador.3 This spending is additional to the cost burden of fuel imports. While subsidies may provide short-term relief and social stability in contexts where attempts at reform have encountered public resistance, they also constrain macroeconomic flexibility. By diverting public resources to support fuel consumption, governments reduce the fiscal space available for long-term investments, including improvements to public transport, transport infrastructure, and essential social programmes. In this way, continued reliance on imported fossil fuels limits the region’s capacity to pursue sustainable and inclusive development.
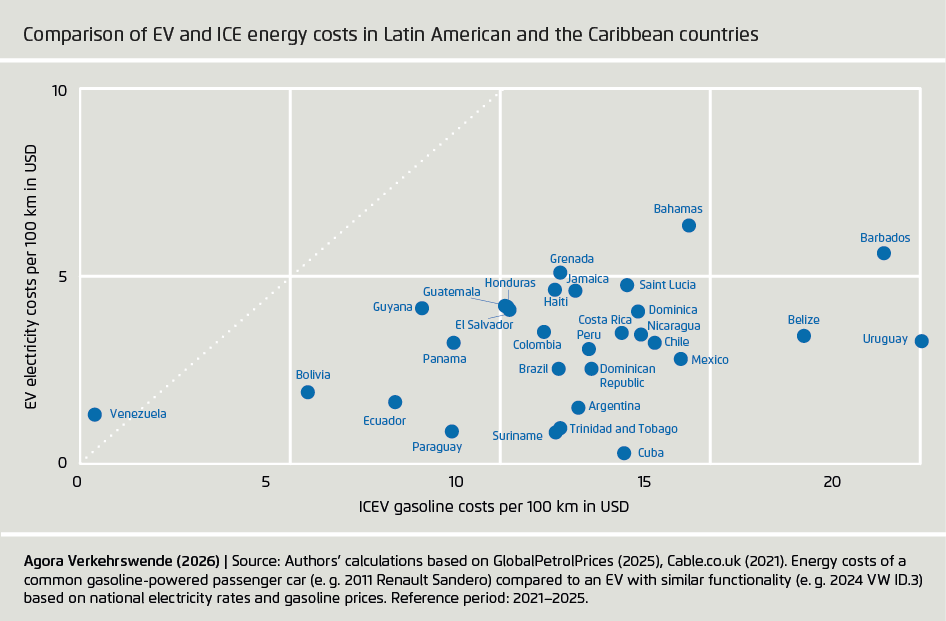
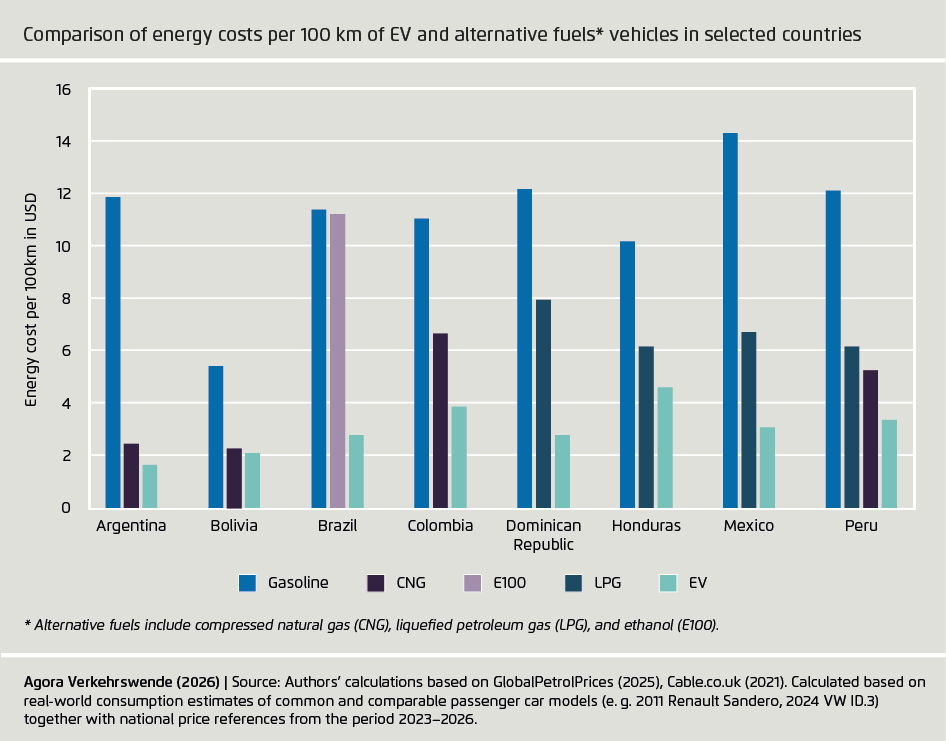
Energy costs per kilometre are significantly lower for electric vehicles (EV) than for internal combustion engine vehicles (ICEV) in most Latin American and Caribbean countries. Our analysis shows that across the region the median energy cost ratio between a gasoline ICE vehicle and a battery electric vehicle is around three to one. In other words, driving 100 kilometres in a conventional petrol car typically costs more than three times as much in terms of energy as travelling the same distance in an electric vehicle. This gap is mainly explained by the higher efficiency of electric drivetrains, which require substantially less energy to move a vehicle than internal combustion engines. Combined with generally favourable electricity prices in many countries, this creates a strong and consistent cost advantage for electric mobility across the region.
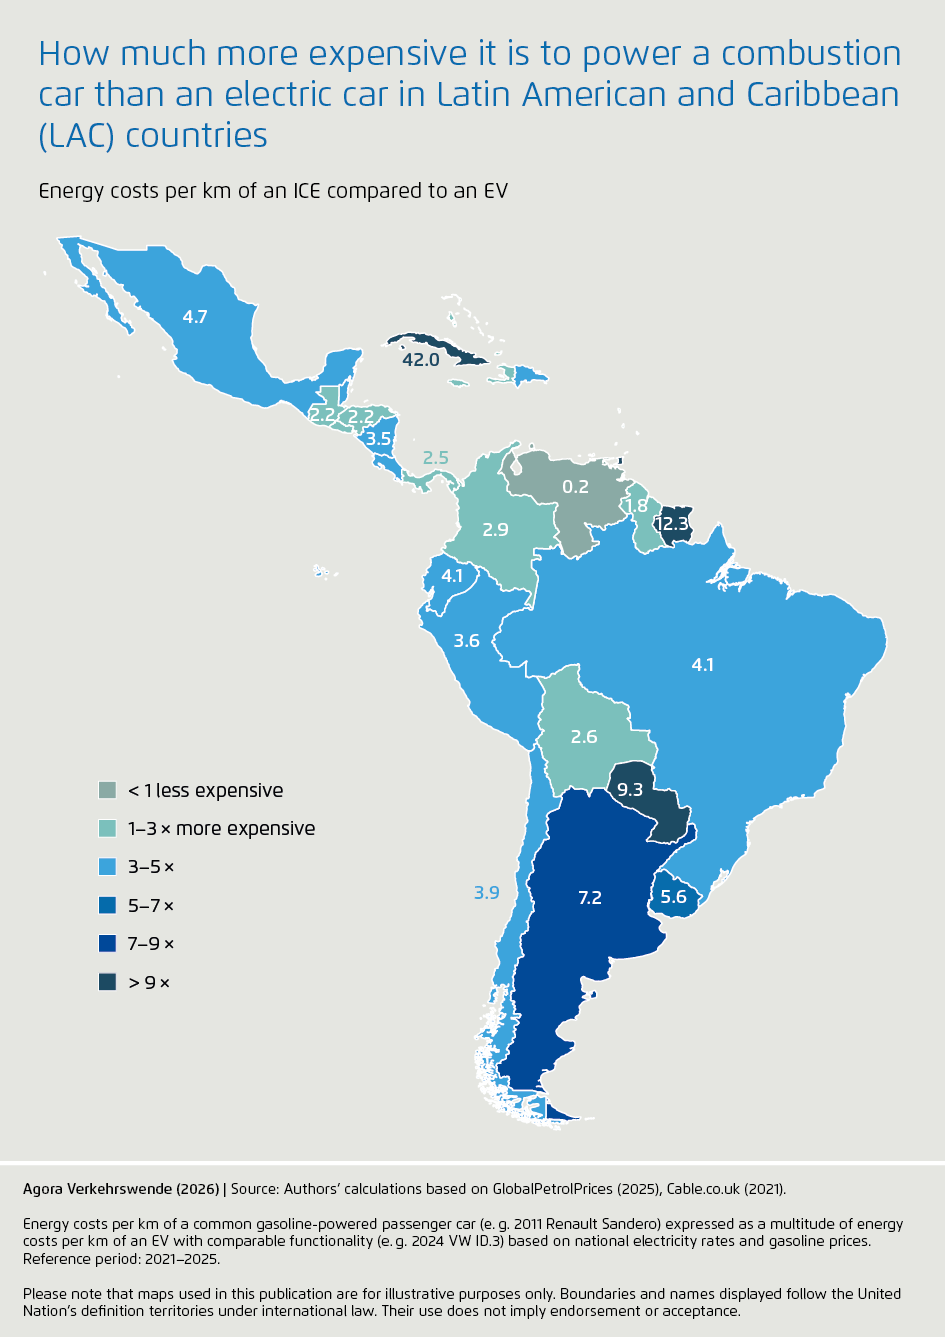
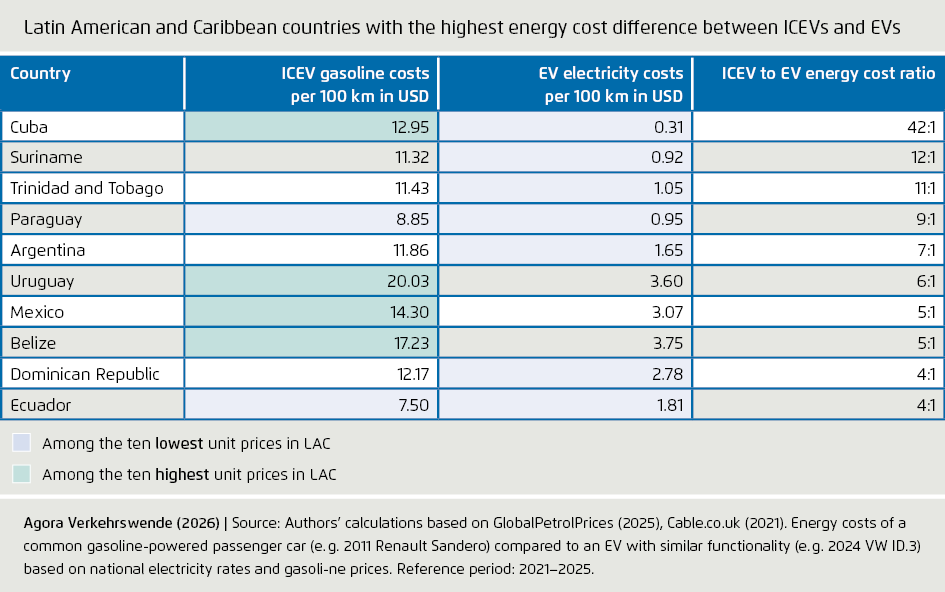
Low electricity prices are the most important factor explaining the countries with the largest cost advantage for electric vehicles. Seven of the ten countries with the cheapest electricity also appear among those ten with the greatest energy cost gap between ICE vehicles and EVs (Cuba, Suriname, Trinidad and Tobago, Paraguay, Argentina, Dominican Republic, and Ecuador). In these markets, electricity prices range from as low as 0.02 up to 0.16 USD per kilowatt-hour, creating low operating costs for electric vehicles, even after adjusting electricity costs upward to reflect a mix of residential and public charging. Across the region, electricity prices in the most expensive markets reach almost twenty times those in the lowest-cost countries. By contrast, gasoline prices, while relevant, show far less proportional variation. Excluding extreme subsidy cases such as Venezuela, the highest gasoline prices are typically only three to four times higher than those in lower-price markets.
Cuba and Venezuela, the outliers of the region, show how different pricing regimes shape contrasting transport energy costs. Cuba shows by far the largest cost advantage for electric vehicles in the region because of exceptionally low electricity tariffs combined with relatively high gasoline prices. Electricity in Cuba is heavily subsidised and centrally regulated, with tariffs far below regional market levels, reflecting a long-standing policy to protect households and strategic sectors. At the same time, the country is grappling with severe fuel shortages and a widening energy crisis, owing in part to disruptions in oil supplies from former partners and limited domestic refining capacity.4 In 2025, Cuba’s fuel imports from traditional suppliers such as Mexico and Venezuela fell sharply, reducing the input available for power generation and transport and underscoring the fragility of its energy system.5 These structural factors explain why the theoretical energy cost advantage for EVs is so large; however, they also point to significant barriers to electrification, including chronic shortages of vehicles and spare parts, very limited charging infrastructure, frequent grid instability, and a pow-er system heavily dependent on imported fossil fuels.
In contrast to Cuba’s case, Venezuela stands at the opposite extreme, as the only country where electric vehicles are currently more expensive to operate than internal combustion vehicles. This outcome is driven by one of the world’s lowest gasoline prices, which are the result of extensive fuel subsidies and domestic oil production. Despite recent price adjustments, gasoline remains heavily subsidised and disconnected from international price formation. Electricity prices are also low, but the relative advantage of electric mobility disappears because the cost of gasoline is close to zero. Together, these two cases illustrate how government pricing policies and domestic energy endowments can shape the competitiveness of electric mobility, often more than technological or efficiency factors alone.
Abundant renewable energy resources in the region, particularly hydropower, provide a structural cost advantage for EVs. With about 62% the Latin American and Caribbean region has the largest share of electricity generated from renewable sources in the world – over two times the global average. Hydropower alone accounted for almost 50% of the region’s electricity generation mix in 2022.6 In some countries, this advantage is notable: Paraguay generates electricity almost entirely from the Itaipú and Yacyretá binational hydroelectric dams, which produce abundant low-cost power.7 This allows Paraguay to offer one of the lowest industrial electricity prices in the region at just $0.05 USD per kilowatt-hour. As a result, the country also exhibits one of the largest energy cost advantages for electric vehicles, illustrating how access to affordable renewable electricity can significantly strengthen the economic case for electrification across the region.
Even when accounting for alternative transport fuels, EVs remain the most cost-effective option across the countries analysed. It is important to recognise that in several countries in the region, alternative fuels such as compressed natural gas (CNG), ethanol (E100), and liquefied petroleum gas (LPG) play an important role in the transport sector. In countries such as Argentina, Bolivia, and Peru, where CNG penetration ranges from eight to nearly 13% of the fleet, natural gas offers operating costs that are substantially lower than gasoline. A similar pattern emerges in Brazil, where ethanol accounts for over one quarter of the fleet and remains cost competitive with gasoline. LPG also provides moderate savings relative to gasoline in countries such as the Dominican Republic, Honduras, and Peru. However, in all cases analysed, electric vehicles still show the lowest energy cost per 100 kilometres. This suggests that, even in countries with well-established alternative fuel markets, electrification already represents the most economically attractive pathway for reducing transport energy costs. In this context, existing alternative fuel systems may provide short term cost relief, but they are unlikely to match the long-term cost and sustainability benefits of electrification.
Lowering overall energy demand and substituting remaining demand with energy from renewable sources can significantly reduce dependence on imported fossil fuels in the transport sector and thus decrease associated cost burdens. This approach means combining demand-side measures, such as transport demand management, improved urban planning, promotion of active mobility, and a modal shift, with supply-side solutions that decarbonise the energy used in mobility. By reducing unnecessary travel, improving efficiency, and prioritising public and shared transport, countries can lower exposure to volatile fuel markets while improving system resilience and affordability.
Electrification, supported by the region’s strong renewable energy base, represents the most scalable pathway to replace fossil fuels in most transport segments.8 At the same time, sustainable fuels will remain essential for sectors that are harder to electrify, including aviation, maritime transport, and parts of long-distance freight. A diversified approach that reflects the different technological and economic realities across transport modes will therefore be key to achieving both energy security and climate objectives.
Ensuring that the transformation improves accessibility and affordability is critical for its long-term success. Policies should prioritise access to reliable, safe, and affordable mobility, especially for low- and middle-income households and underserved communities, so that decarbonisation does not come at the cost of social inclusion. In some countries in the region, around one-fifth of the rural population still lacks reliable access to all-weather roads,9 and low-income households often designate a higher share of their income to transport and energy costs,10 highlighting that improving accessibility and transport resilience must go hand in hand with decarbonisation.
Strong policy frameworks and regional cooperation are essential to enable transformation to a cheaper, cleaner, and resilient transport system. Governments can play a decisive role by aligning energy, transport, and industrial strategies; supporting infrastructure deployment; and creating stable regulatory environments that mobilise private investment. Collaboration across countries, through knowledge sharing, harmonised standards, and joint financing mechanisms, can accelerate the transformation while reducing costs. Ultimately, a coordinated approach that links energy security, economic development, and social inclusion can ensure that the transition away from imported fossil fuels strengthens both resilience and long-term development in Latin America and the Caribbean.
1 World Bank Group (2023)
2 SLOCAT (2025)
3 Castellanos (2025)
4 Ricardo Torres (2026)
5 Gael Badra (2025)
6 Statista (2025)
7 PVknowhow (2025)
8 Agora Verkehrswende (2026)
9 Jeffrey D. Sachs et al. (2025)
10 Oviedo, Meléndez Fuentes and Chong (2025)
The scope of the analysis was the Latin American and the Caribbean region, excluding non-sovereign territories and dependent territories (i.e. British Overseas Territories, the Dutch Caribbean and Carib-bean Netherlands, French Overseas Departments and Collectivities, and US Territories).
This section outlines the methodology employed to calculate the financial burden of imported gasoline and diesel used in the transport sector, expressed as a percentage of national gross domestic product (GDP) for the reference year 2022.
Volume of fuel imports used in road transport:
For each country, the volume of fuel imports destined for road transport was estimated by applying the national road transport sector’s share of fuel consumption to the total import volume. This approach accounts for the fact that imported fuels are distributed across various sectors (e.g. agriculture, industry, residential), adjusting the import cost burden accordingly.
Costs for transport fuel imports and crude oil exports:
The estimated import volumes for gasoline and diesel were valued using their respective benchmark prices and summed to yield total annual import costs. The same procedure was used to value the crude oil export volumes per country.
Comparison to GDP:
Transport fuel import values and crude oil export values were placed in relation to each country’s 2022 GDP and expressed as a percentage. This ratio serves as the key indicator for comparing the relative financial impact of imported transport fuels across different countries. One caveat pertains to data quality and comprehensiveness, both for GDP and fossil fuel imports. GDP numbers reflect best-guess estimates due to known coverage issues, including in particular non-coverage of informal sectors, which make up significant share of the economy in many countries. The comprehensiveness of fuel import databases differs between countries, as grey markets exist alongside official registries, particularly in landlocked countries. To an extent, both factors may balance each other out, as countries with less accurate import registries tend on average to also have less complete GDP data – and vice versa.
ICEV to EV Consumption:
To estimate energy costs, it was assumed an ideal-type consumption value per 100 kilometres, representative of vehicle uses in the region. Across LAC the average vehicle age is estimated at 12 to 15 years, equalling a production year between 2011 and 2014.17 Data for the region’s largest automotive markets confirm this.18 Market intelligence data on passenger cars common in the fleets of some of the continent’s largest automotive markets are also available.19 Across LAC, bans on the import of used vehicles are common. Hence for the comparison with EVs we chose only new vehicles that were still in production at the time of publication. All data was cross-checked for coherence and plausibility.
In consequence, the following pool of common passenger cars with comparable functionality was determined:
ICEV pool consumption:20
EV pool consumption:21
A correction factor to account for the difference in type approval and real-world consumption was added based on a literature review while also taking into account local factors, including the share of urban traffic, climatic conditions, use profiles, and ethanol blend.25 In consequence, a correction factor of 30% for ICEVs (+2.3l/100km) and 15% for EVs (+2.3 kWh/100km) was added to type approval values, thus leading to the following assumed consumption values:
ICEV: 10 l/100km
EV: 17.5 kWh/100km
4. Role of alternative fuels:
Alternative fuels play a major role in some Latin American countries and are often promoted as cleaner alternatives to gasoline or diesel. For this reason, alternative fuels were also included in this analysis to compare costs to gasoline-powered and battery-electric cars. Alternative fuels here include compressed natural gas (CNG), liquefied petroleum gas (LPG), and ethanol (E100). Diesel was not taken into account as it plays no role as transition technology due to a lack of significant GHG emission reductions or cost benefits.
Seven countries were identified having a significant share of alternative fuel consumption:
5. Alternative fuels energy cost calculation:
Fuel consumption for alternative vehicles was calculated as follow:
Alternative fuels prices were obtained from GlobalPetrolPrices.com33 when available; otherwise, national sources were consulted.34 All prices are expressed in nominal US dollars. National price data originally reported in local currencies were converted to US dollars, which may affect comparability in countries with significant exchange rate volatility or where informal currency markets are prevalent.35 In some cases, price data for gasoline and alternative fuels such as LPG or E100 were not available for exactly the same date, which may introduce minor variations due to short-term price fluctuations. For ethanol (E100), long-term analyses by Brazilian authorities indicate that ethanol prices tend to remain broadly close to gasoline prices.36
11 IEA (2025)
12 World Bank (continuous)
13 IndexMundi (continuous)
14 GlobalPetrolPrices.com (2025)
15 Cable.co.uk (2021)
16 GlobalPetrolPrices.com (2026b)
17 Alianza Automotriz (2025) GiPA (2025)
18 AFAC Autopartes Argentinas (2025), Toledo (2025)
19 IDF, MEMA Aftermarket Supplier (2023)
20 All vehicle consumption data if not otherwise specified from Auto-Data.net (2025)
21 Ibid.
22 BYD (2025a)
23 BYD (2025b)
24 Licarco (2024)
25 Uwe Tietge et al. (2015), CR Advocacy (2016), European Commission (2024), TNO (2023), UN DESA (2025), World Bank (2025), PuraCars (2025)
26 Calculated based on national and international data: Asociación Automotriz del Perú (2023), Oxford Institute for Energy Studies (2019), El Deber (2025), Ministerio de Transportes y Comunicaciones Perú (2025a)
27 CEPAL (2026)
28 Note the different base year of 2022 for the LPG fleet, while total vehicle fleet base year varies (2022–2025), potentially causing a slight underestimation of the LPG fleet, assuming strong fleet growth between base years.
WLPGA, Argus Media (2023), Ministerio de Transportes y Comunicaciones Perú (2025b), DGII (2022), US International Trade Administration (2024)
29 WLPGA, Argus Media (2023), Instituto Nacional de Estadística y Geografía Mexico (2024)
30 ADAC (2007), IEA-AMF (no date)
31 IEA-AMF (no date), Filho et al. (2022)
32 Koay, Sah and bin Othman (2019), ADAC (2025)
33 (GlobalPetrolPrices.com, 2026a), (GlobalPetrolPrices.com, 2026c)
34 (Combustibles en Argentina, 2026), (Estado Plurinacional de Bolivia, 2026), (Gasolina Agora, 2026), (Gobierno de Colombia, 2026), (Asociación Gas Natural, no date), (TV Azteca Noticias, 2026)
35 (InforEuro, 2026)
36 (Ministério da Agricultura e Pecuária, 2026)
ADAC (2007) Fiat Panda 1.2 8V Natural Power Panda Panda (Erdgasbetrieb) (03/07 - 08/10). Available at: www.adac.de/rund-ums-fahrzeug/autokatalog/marken-modelle/fiat/panda/169/208421/ (Accessed: 11 March 2026).
ADAC (2025) Autogas als Alternative zu Benzin. Available at: assets.adac.de/image/upload/v1740491944/ADAC-eV/KOR/Text/PDF/FTKInfo_Autogas_ric6mj.pdf.
AFAC Autopartes Argentinas (2025) ‘Flota Vehicular Circulante en Argentina 2024’. Available at: cdn.motor1.com/pdf-files/afac-flota-circulante-2024-copia3.pdf.
Agora Verkehrswende (2026) EV NDC World Map. Available at: www.agora-verkehrswende.org/publications/ev-ndc-world-map (Accessed: 1 March 2026).
Alianza Automotriz (2025) Parque vehicular en LATAM: viejo, diverso y en transformación. Available at: alianzaautomotriz.com/parque-vehicular-en-latam-viejo-diverso-y-en-transformacion/.
Asociación Automotriz del Perú (2023) Evolución del Mercado de Gas Natural Vehicular en el 2023. Available at: aap.org.pe/observatorio-aap/evolucion-del-mercado-de-gnv-2023/Evolucion-del-Mercado-de-GNV-2023.pdf.
Asociación Gas Natural (no date) ‘Gas natural vehicular’. Available at: www.agnchile.cl/gas-natural-vehicular/ (Accessed: 11 March 2026).
Auto-Data.net (2025) Technical specs, data, fuel consumption of cars. Available at: www.auto-data.net/en/ (Accessed: 10 March 2026).
BYD (2025a) EV Database - BYD ATTO 3 (MY25). Available at: ev-database.org/car/3192/BYD-ATTO-3 (Accessed: 11 March 2026).
BYD (2025b) EV Database - BYD DOLPHIN 60.4 kWh (MY25). Available at: ev-database.org/car/3297/BYD-DOLPHIN-604-kWh (Accessed: 11 March 2026).
Cable.co.uk (2021) Global electricity pricing study. Available at: bestbroadbanddeals.co.uk/energy/worldwide-pricing/ (Accessed: 10 March 2026).
Castellanos, D.S. (2025) La costosa factura de los subsidios a combustibles en Latam: estos países están más presionados, Bloomberg Línea. Available at: www.bloomberglinea.com/economia/la-costosa-factura-de-los-subsidios-a-combustibles-en-latam-estos-paises-estan-mas-presionados/ (Accessed: 27 February 2026).
CEPAL (2026) BIEE - Base de Indicadores de Eficiencia Energética | Share of biofuels in gasoline and diesel consumption of road transport. Available at: biee-cepal.enerdata.net/en/datamapper/share-of-biofuels-in-gasoline-and-diesel-consumption-of-road-transport.html (Accessed: 11 March 2026).
Combustibles en Argentina (2026) Precio de GNC en Buenos Aires. Available at: combustibles.ar/precios/buenos-aires/producto/gnc (Accessed: 11 March 2026).
CR Advocacy (2016) ‘How Accurate are EPA’s Fuel Economy Labels?’, CR Advocacy. Available at: advocacy.consumerreports.org/research/epa-mpg-label-analysis-2016/ (Accessed: 11 March 2026).
DGII (2022) Parque Vehicular. Available at: dgii.gov.do/estadisticas/parqueVehicular/1Informes%20Parque%20Vehicular/ParqueVehicular2022.pdf.
El Deber (2025) ‘Conversión a GNV es solo un 8,1% del parque automotor de Bolivia.’, 24 March. Available at: epaper.eldeber.com.bo/2025/03/24/1/pdf/pag_06.pdf.
Estado Plurinacional de Bolivia (2026) Decreto Supremo 5516 13/01/2026. Art. 2. Available at: bolivia.infoleyes.com/norma/8565/decreto-supremo-5516 (Accessed: 11 March 2026).
European Commission (2024) Commission report under Article 12(3) of Regulation (EU) 2019/631 on the evolution of the real-world CO2 emissions gap for passenger cars and light commercial vehicles and containing the anonymised and aggregated real-world datasets referred to in Article 12 of Commission Implementing Regulation (EU) 2021/392.
Filho, A.S.N. et al. (2022) ‘Induction of a Consumption Pattern for Ethanol and Gasoline in Brazil’, Sustainability, 14(15). Available at: doi.org/10.3390/su14159047.
Gael Badra (2025) Blackouts in Cuba: An increasingly dark crisis, Global Affairs and Strategic Studies. Available at: en.unav.edu/web/global-affairs/apagones-en-cuba-una-crisis-cada-vez-mas-oscura (Accessed: 28 February 2026).
Gasolina Agora (2026) Preço do GNV no Brasil. Available at: gasolinaagora.com.br/gnv (Accessed: 11 March 2026).
GiPA (2025) ‘Latin American Aftermarket Trends & Insights’, GiPA. Available at: www.gipa.eu/announcement/latin-american-aftermarket-trends-insights/ (Accessed: 10 March 2026).
GlobalPetrolPrices.com (2025) Electricity prices around the world, GlobalPetrolPrices.com. Available at: www.globalpetrolprices.com/electricity_prices/ (Accessed: 10 March 2026).
GlobalPetrolPrices.com (2026a) Ethanol prices around the world, GlobalPetrolPrices.com. Available at: www.globalpetrolprices.com/ethanol_prices/ (Accessed: 11 March 2026).
GlobalPetrolPrices.com (2026b) Gasoline prices around the world, GlobalPetrolPrices.com. Available at: www.globalpetrolprices.com/gasoline_prices/ (Accessed: 10 March 2026).
GlobalPetrolPrices.com (2026c) LPG prices around the world. Available at: www.globalpetrolprices.com/lpg_prices/ (Accessed: 11 March 2026).
Gobierno de Colombia (2026) Consulta Precios Promedio de Gas Natural Comprimido Vehicular (AUTOMATIZADO) | Datos Abiertos Colombia. Available at: www.datos.gov.co/Minas-y-Energ-a/Consulta-Precios-Promedio-de-Gas-Natural-Comprimid/he3q-86dn/about_data (Accessed: 11 March 2026).
IDF, MEMA Aftermarket Supplier (2023) LATAM VIO Trends 2023 Edition 1. Available at: www.mema.org/system/files/Latin%20America%20VIO%20Aftermarket%20Report%202023%20Edition.pdf.
IEA (2025) World Energy Statistics. Available at: www.iea.org/data-and-statistics/data-product/world-energy-statistics (Accessed: 10 March 2026).
IEA-AMF (no date) Technology Collaboration Programme on Advanced Motor Fuels. Available at: iea-amf.org/content/fuel_information/ (Accessed: 11 March 2026).
IndexMundi (Continuous) Commodity Prices - Price Charts, Data, and News. Available at: www.indexmundi.com/commodities/ (Accessed: 10 March 2026).
InforEuro, (2026) The exchange rate of the Euro currency. Available at: commission.europa.eu/funding-tenders/procedures-guidelines-tenders/information-contractors-and-beneficiaries/exchange-rate-inforeuro_en (Accessed: 11 March 2026).
Instituto Nacional de Estadística y Geografía Mexico (2024) ‘Vehículos de Motor Registrados en Circulación del Año 2024’. Available at: www.inegi.org.mx/contenidos/temas/economia/vehiculos/tabulados/vmrc.xlsx.
Jeffrey D. Sachs et al. (2025) Sustainable Development Report 2025. Available at: dashboards.sdgindex.org (Accessed: 1 March 2026).
Koay, L.K., Sah, M.J.M. and bin Othman, R. (2019) ‘Comparative Study of Fuel Consumption, Acceleration and Emission for Road Vehicle Using LPG or Gasoline’, in A. Ismail, M.H. Abu Bakar, and A. Öchsner (eds) Advanced Engineering for Processes and Technologies. Cham: Springer International Publishing, pp. 77–87. Available at: doi.org/10.1007/978-3-030-05621-6_6.
Licarco (2024) JAC E10X Features, Price, and Comparisons - Licarco, Licarco - All Electric Vehicle, EV Specifications on licarco.com. Available at: licarco.com/jac-e10x (Accessed: 11 March 2026).
Ministério da Agricultura e Pecuária (2026) ‘Comparativo Etanol Hidratado x Gasolina no Brasil 2015 a 2025’. Available at: www.gov.br/agricultura/pt-br/assuntos/sustentabilidade/agroenergia/arquivos-precos/013SRIEHISTRICADAPARIDADETCNICADOETANOLGASOLINANOBRASIL_03022025.pdf.
Ministerio de Transportes y Comunicaciones Perú (2025a) Estadística - Servicios de Transporte Terrestre por Carretera - Parque Automotor. Available at: www.gob.pe/institucion/mtc/informes-publicaciones/344892-estadisticaservicios-de-transporte-terrestre-por-carretera-parque-automotor (Accessed: 11 March 2026).
Ministerio de Transportes y Comunicaciones Perú (2025b) Servicios de Transporte Terrestre por Carretera - Parque Automotor. Available at: www.gob.pe/institucion/mtc/informes-publicaciones/344892-estadisticaservicios-de-transporte-terrestre-por-carretera-parque-automotor (Accessed: 11 March 2026).
Oviedo, D., Meléndez Fuentes, N. and Chong, A.Z.W. (2025) ‘Transport Affordability Across Time and Space: Considerations for Latin America and the Caribbean and Other Global South Settings’, Journal of Planning Literature, p. 08854122251343876. Available at: doi.org/10.1177/08854122251343876.
Oxford Institute for Energy Studies (2019) ‘A review of prospects for natural gas as a fuel in road transport’, Oxford Institute for Energy Studies. Available at: www.oxfordenergy.org/publications/review-prospects-natural-gas-fuel-road-transport/ (Accessed: 11 March 2026).
PuraCars (2025) Navigating Latin America’s Car Market Challenges to Opportunities | PuraCars Blog | PuraCars - Costa Rica Car Services, PuraCars. Available at: puracars.com/post/navigating-latin-americas-car-market-challenges-to-opportunities (Accessed: 11 March 2026).
PVknowhow (2025) ‘Paraguay tech hub: Unique 2024 clean energy plan unveiled’. Available at: www.pvknowhow.com/news/paraguay-tech-hub-unique-2024-clean-energy-plan-unveiled/ (Accessed: 28 February 2026).
Ricardo Torres (2026) La crisis energética en Cuba: raíces estructurales y perspectiva comparada, Cuba Capacity Building Project. Available at: horizontecubano.law.columbia.edu/news/la-crisis-energetica-en-cuba-raices-estructurales-y-perspectiva-comparada (Accessed: 28 February 2026).
SLOCAT (2025) ‘Regional Overviews Latin America and the Caribbean’, Transport, Climate and Sustainability Global Status Report (GSR) – 4th Edition. Available at: gsr4.slocat.net/modules/regional-overviews/ (Accessed: 27 February 2026).
Statista (2025) Topic: Electricity in Latin America, Statista. Available at: www.statista.com/topics/12217/electricity-in-latin-america/ (Accessed: 28 February 2026).
TNO (2023) Real-world fuel consumption and electricity consumption of passenger cars and light commercial vehicles 2023. Available at: publications.tno.nl/publication/34642358/YuUfgl/TNO-2023-R12726.pdf.
Toledo, A. (2025) ‘Entérate de las tendencias del parque vehicular en México y Latinoamérica’, Factor Automotor, 16 July. Available at: factorautomotor.com/enterate-de-las-tendencias-del-parque-vehicular-en-mexico-y-latinoamerica/ (Accessed: 10 March 2026).
TV Azteca Noticias (2026) Precio Gas LP 22 al 28 de febrero 2026: Tabla completa oficial. Available at: www.tvazteca.com/aztecanoticias/precio-gas-lp-22-al-28-febrero-2026-mexico-cdmx-edomex-baja-california-sur/ (Accessed: 11 March 2026).
UN DESA (2025) World Urbanization Prospects. Available at: population.un.org/wup/ (Accessed: 11 March 2026).
US International Trade Administration (2024) Honduras - Automotive Aftermarket. Available at: www.trade.gov/country-commercial-guides/honduras-automotive-aftermarket (Accessed: 11 March 2026).
Uwe Tietge et al. (2015) ‘From laboratory to road: A 2015 update’, International Council on Clean Transportation, 24 September. Available at: theicct.org/publication/from-laboratory-to-road-a-2015-update/ (Accessed: 11 March 2026).
WLPGA, Argus Media (2023) Statistical Review of Global LPG 2023. Available at: www.smf.com.sg/wp-content/uploads/2024/07/WLPGA-Statistical-Review-2023.pdf.
World Bank (2025) Urban population (% of total population) – Latin America & Caribbean, World Bank Open Data. Available at: data.worldbank.org (Accessed: 11 March 2026).
World Bank (Continuous) World Development Indicators | DataBank. Available at: databank.worldbank.org/source/world-development-indicators (Accessed: 1 October 2024).